
Community Engagement · Development Strategy · Urban Planning
Northwest Landing Vision Plan
Indianapolis, Indiana
What
Proformus partnered with the Aspire Higher Foundation to develop the Northwest Landing Quality of Life Vision Plan — a shared guide for a near-northwest-side Indianapolis neighborhood of roughly 2,450 residents across ~435 acres, now steadying after decades of disinvestment. Shaped over eight months by more than 196 residents, business owners, and neighbors, the plan begins with an honest look at the neighborhood today and lays out a practical path to growth on its own terms, without pushing anyone out.
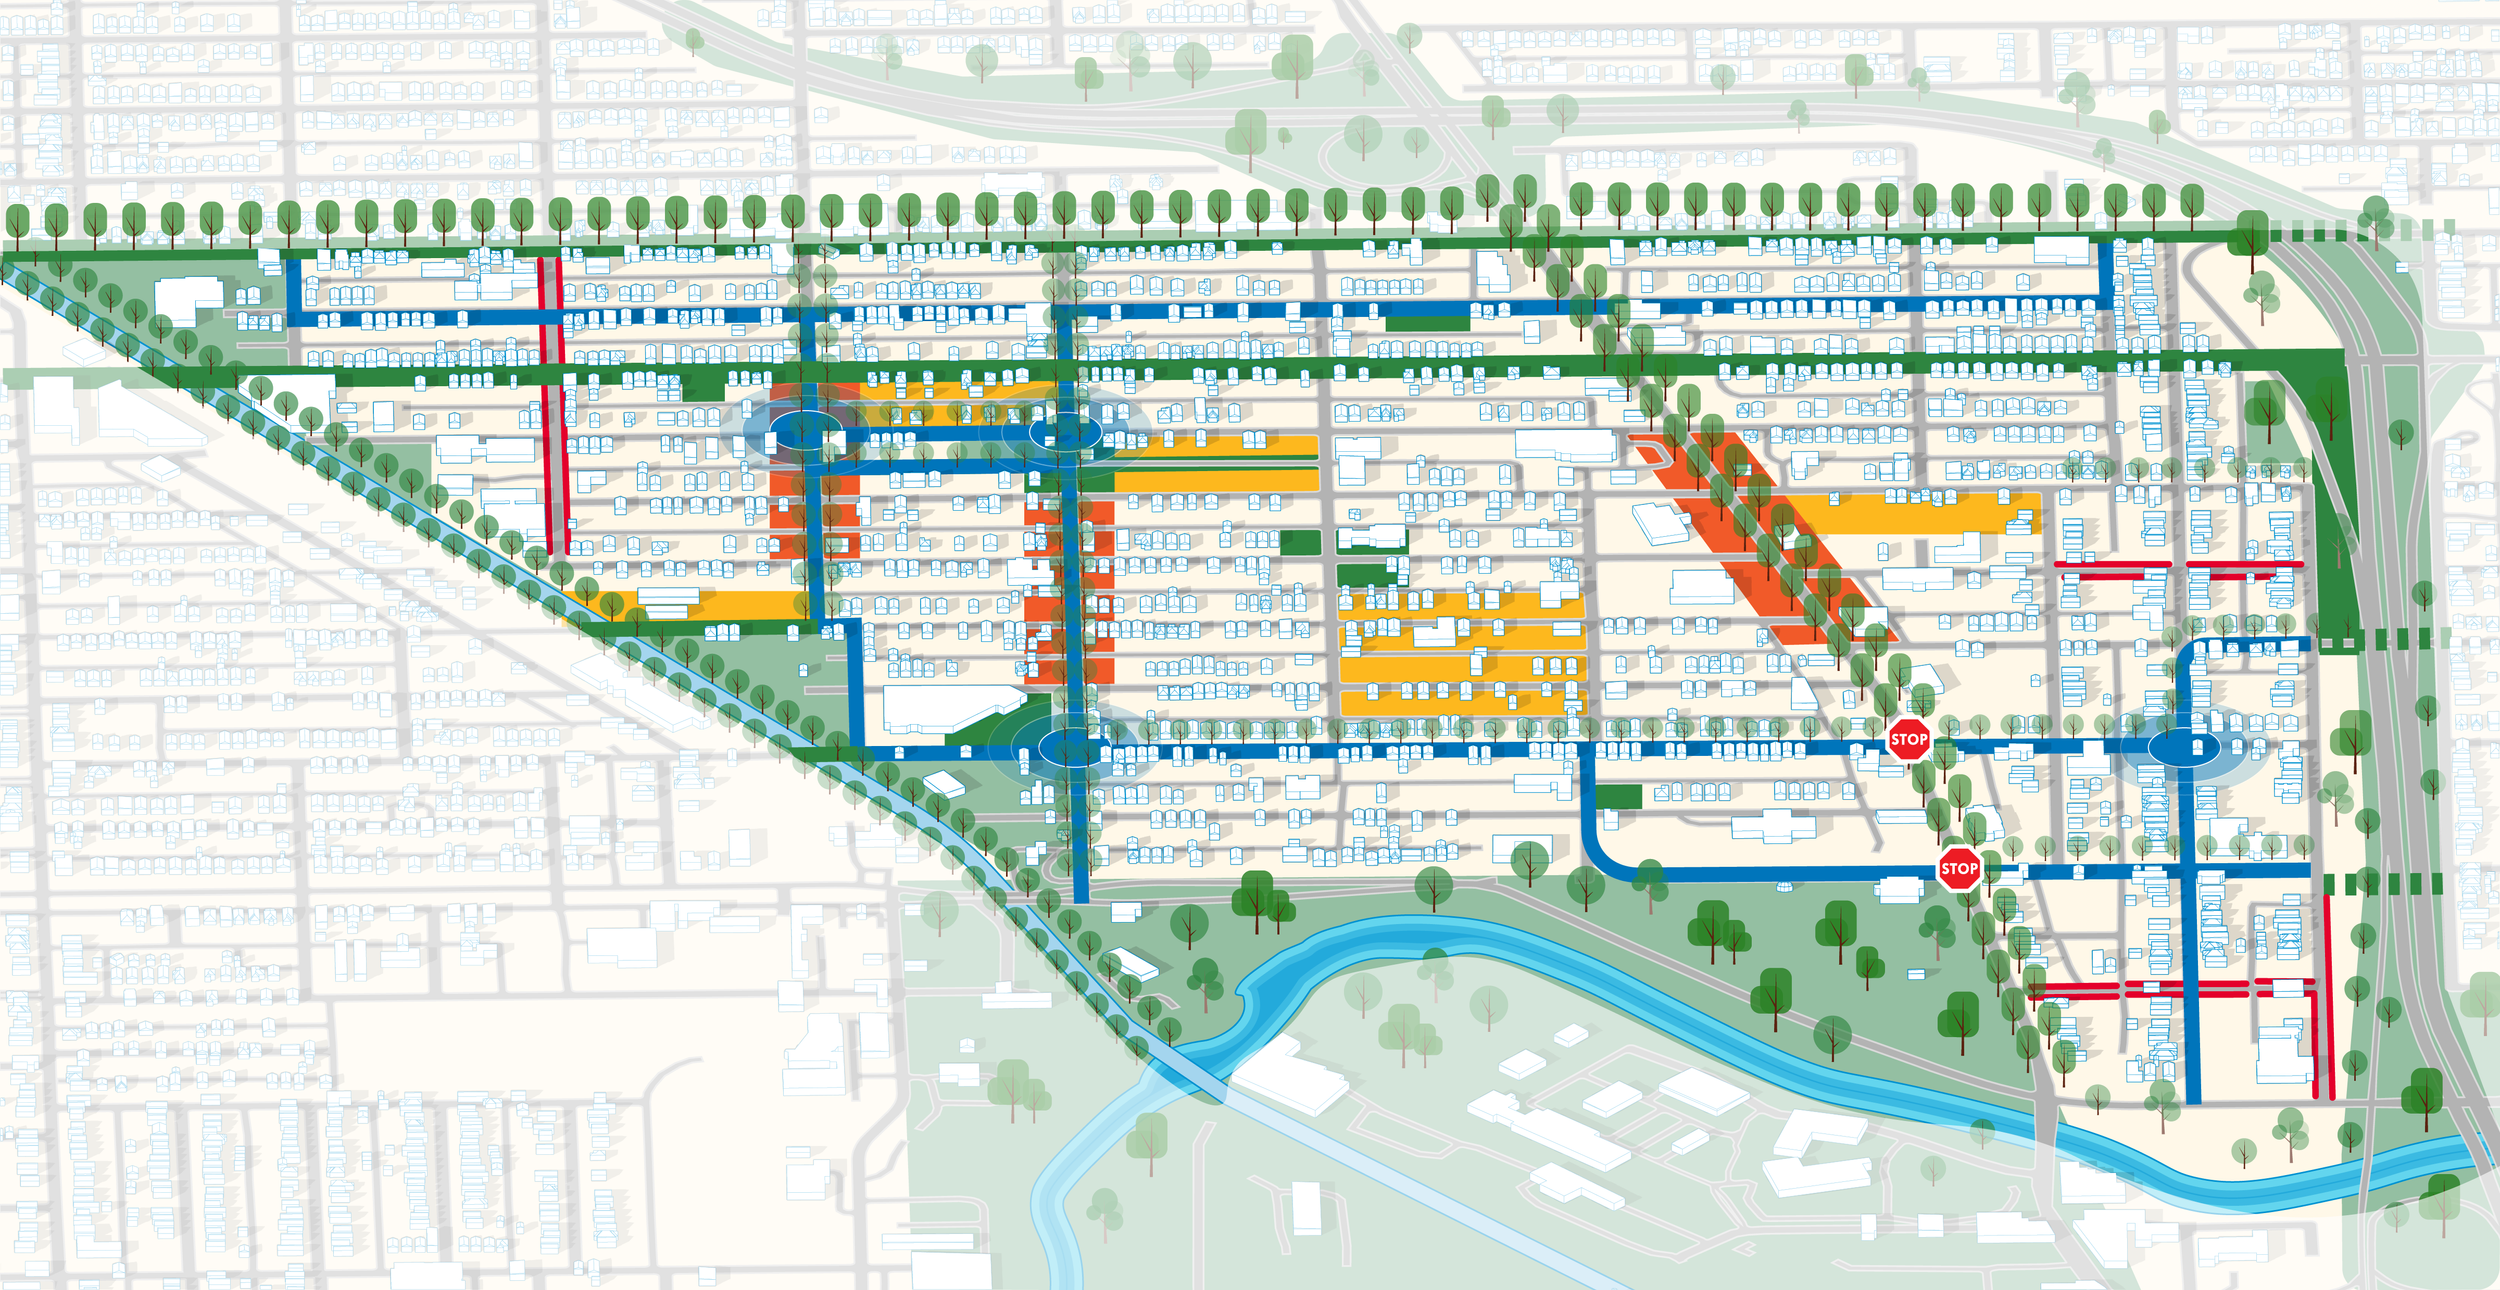
The work translates that engagement into a spatial framework the neighborhood can build from: land-to-assessed-value mapping that pinpoints where small-scale reinvestment yields the most tax-base recovery, catalytic site identification, and Missing Middle infill scenarios on real parcels with real numbers. Organized around a Move / Live / Play place framework, the plan connects safer streets and Neighborways, housing and commercial infill, and a completed Kessler "Diamond Necklace" greenway into a single legible system — with a new Northwest Landing CDC positioned to convene the capital that carries it forward.
The market baseline · 2010–2024
Steady on the surface. Turning over underneath.
Before suggestions began, Proformus built the neighborhood's demographic and market profile from four vintages of Census data, inflation-adjusted and read against county benchmarks. Between 2010 and 2024 the total population barely moved — and nearly everything underneath it did.
Who lives here has changed
Race & ethnicity, share of total population
Biggest movers
The total is flat. The people aren't.
Population by group, 2010–2024
Home values doubled in four years
Median home value, $ thousands
Composition change without population change usually means turnover: the neighborhood didn't grow, it traded one population for another. Rising values reward long-time owners who stay and sell — and pressure renters, prospective buyers, and the tax bills of fixed-income seniors. This is the arithmetic the plan is built to change.
U.S. Census Bureau, ACS 5-year estimates (2006–2010 through 2020–2024), tract 3512.00, Marion County, IN. Dollar figures in constant 2024 dollars (BLS CPI-U). Tract-level ACS estimates carry meaningful margins of error; treat single-vintage magnitudes as directional. The 2021–2025 vintage, releasing late 2026, will test whether the 2020–2024 shift holds.
How the plan is built
From listening to evidence to action
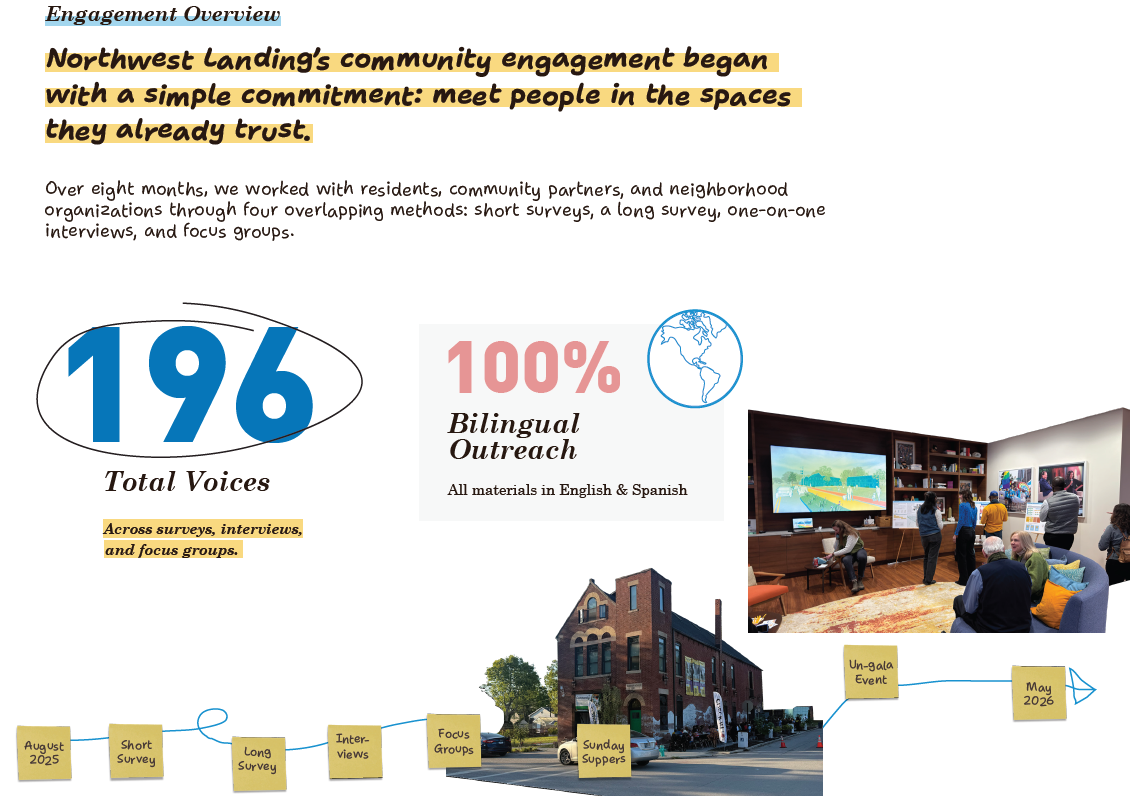
The plan starts where the neighborhood does: eight months of conversation — short and long surveys, one-on-one interviews, and focus groups held in the churches, senior housing, and on the doorsteps people already trust — read against a market and demographic profile Proformus built from four vintages of Census data, parcel records, transit feeds, and health indices, inflation-adjusted and benchmarked to Marion County. The two records tell one story. Residents described a neighborhood changing under their feet; the data measured it: total population flat since 2010 while nearly a thousand Black residents left, the median age up fifteen years since 2020, and the typical home worth $58,800 more — in real terms — than four years ago.
The record is just as honest about what's working. Unemployment fell from 30% to 8% in nine years — the steepest improvement in any metric tracked — vacancy dropped from 44% of all homes to 18%, and the share of households strained by housing costs fell for owners and renters alike. But the gains cluster at the bottom of the ladder, not the top: the four-year-degree share sat flat at 9% while the county climbed to 35%, and real household income rose 13% while home values rose 75% — appreciation accruing to homeowners rather than to wage earners, and recovery arriving without replacement of what was lost.
A neighborhood that turned over that fast without growing has already seen what unmanaged change does. That is why the plan's non-negotiable isn't rhetorical: growth without displacement is the test every recommendation has to pass — whether reinvestment compounds for the longtime residents who held the neighborhood together and keeps homes within reach, or quietly trades them out. The evidence didn't just motivate that test. It wrote the agenda, finding by finding.
The data set the agenda
Anti-displacement is structural, not thematic: every housing tactic carries a displacement screen, and the plan leads with protecting the identity and institutions long-time residents built.
Goal 1.1Goal 4.1The Play framework is built for who actually lives here: multigenerational gathering places, aging-in-place supports, and safety understood as connection — because isolation at neighborhood scale is a design problem, not just a social one.
Goal 1.2Goal 4.3Missing Middle infill adds attainably priced homes on vacant land instead of bidding up occupied ones — and the plan names protecting senior owners from value-rise displacement as a strategic priority, starting with reassessment relief before the next bill arrives.
Goal 4.1Goal 4.2Recovery is parcel-by-parcel work, not block clearance: small-scale rehabilitation and 2–12-unit infill targeted outward from the stable Flanner House and Aspire House anchors, rebuilding the tax base without repeating the demolition playbook that failed neighborhoods like this one.
Goal 1.3Goal 4.1The Move framework treats the sidewalk and the bus stop as the transportation system: closing sidewalk gaps, safer crossings on the best-connected blocks, calmed Neighborways, and stitching the car-free interior to the trails and frequent transit that today only graze the edges.
Goal 2.2Goal 4.4Essentials are planned as one system: fresh-food and daily-needs commerce within walking distance, health access paired with the environment that shapes it — where shade, canopy, and green stormwater land first on the most-paved, least-shaded blocks, the same intervention pays back twice.
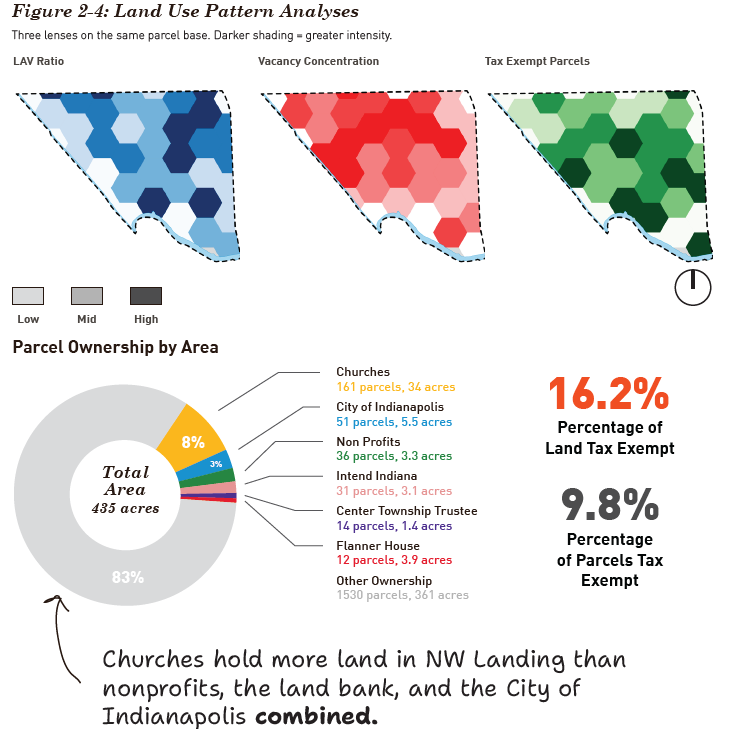
Goal 2.1Goal 2.3Faith institutions are engaged early as primary land partners, not bystanders — their holdings, alongside Flanner House's, are the largest lever the neighborhood controls over how the housing strategy unfolds.
Goal 3.2Governance is rebuilt for the neighborhood as it is now: bilingual outreach, standing accountability structures so renter concerns stay on the civic agenda, and a Northwest Landing CDC to convene the arriving capital on the neighborhood's terms.
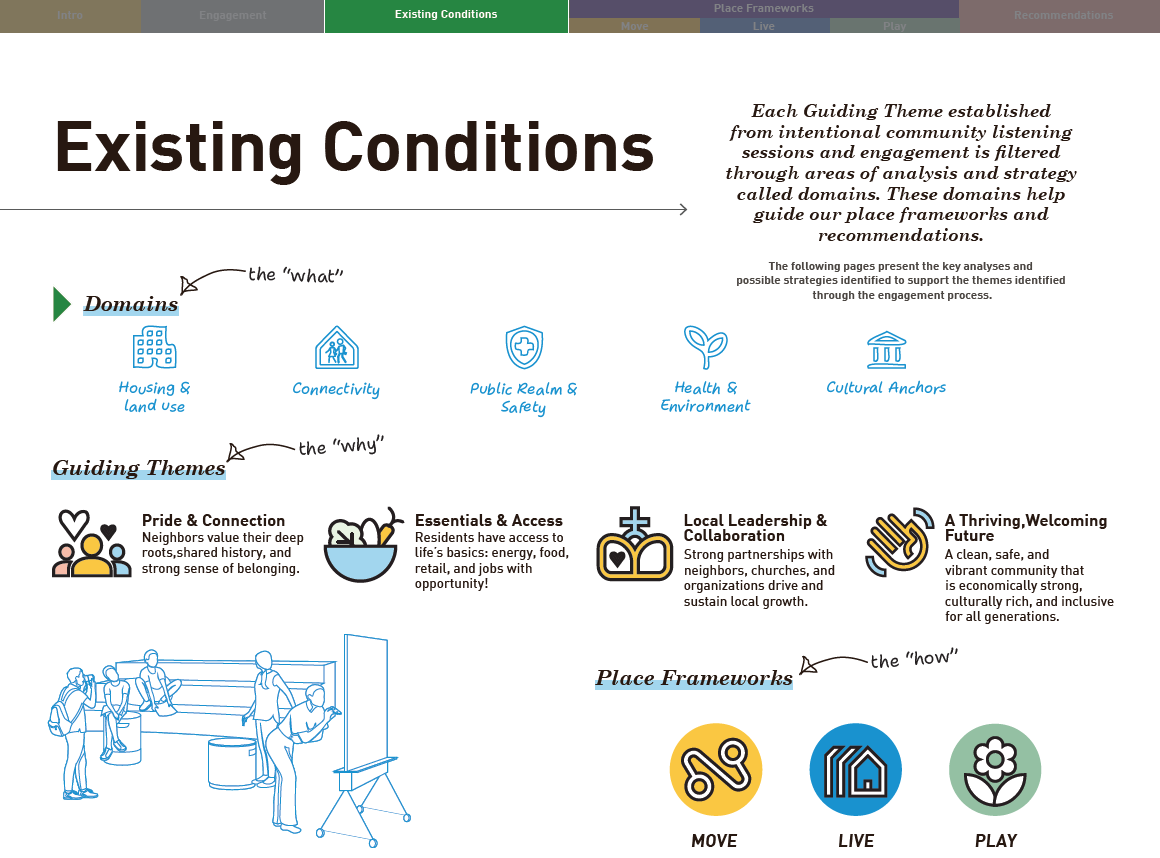
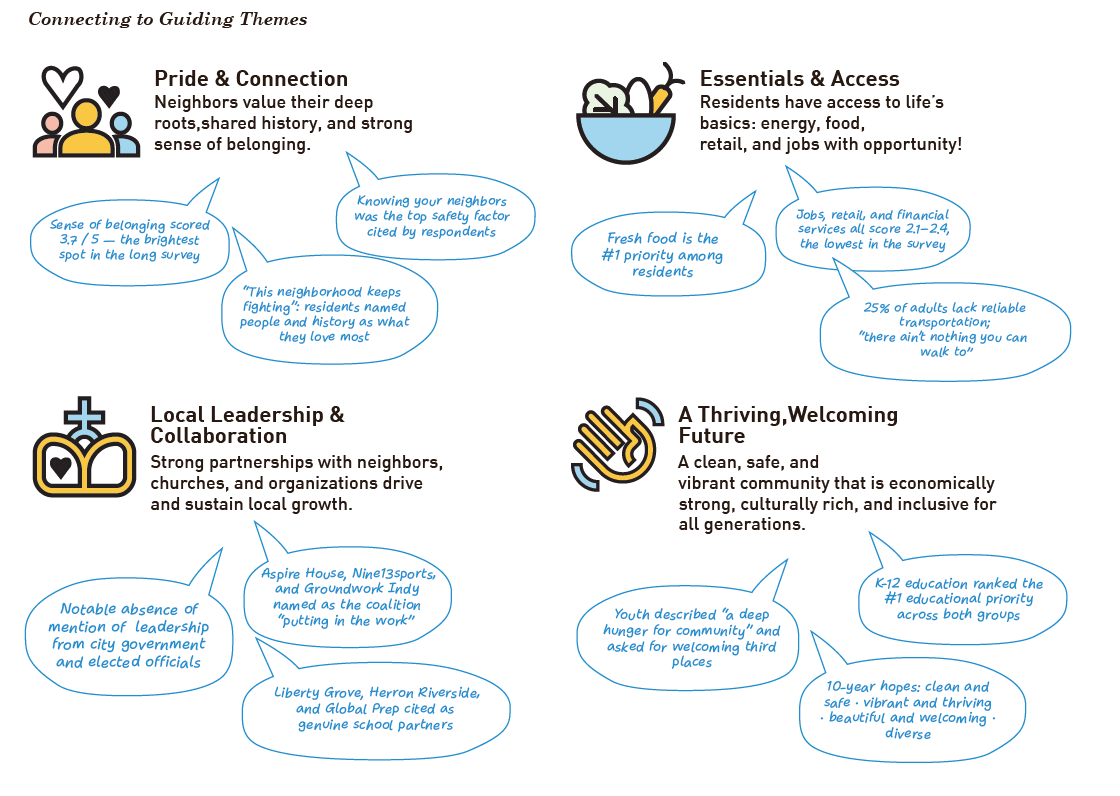
Goal 3.1Goal 3.3Goal 3.4Four guiding themes
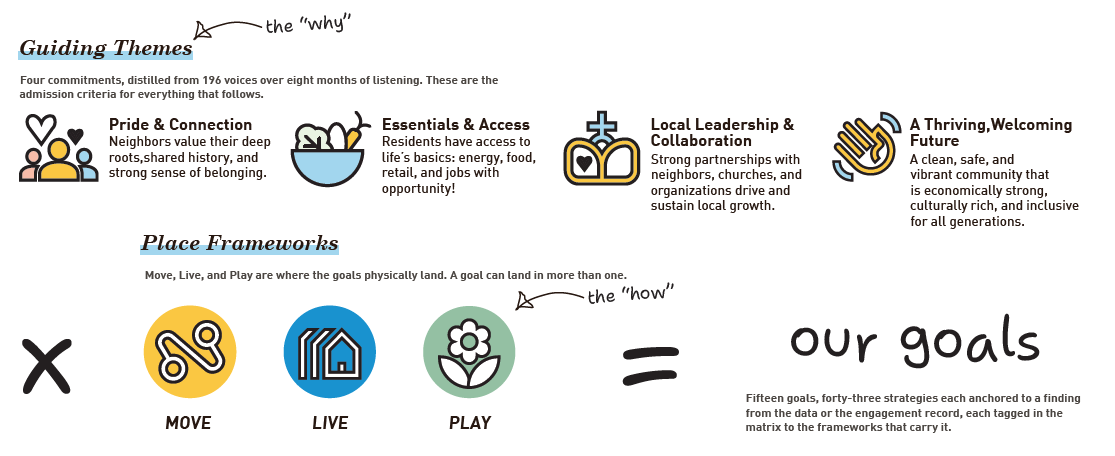
Resolved through three place frameworks
The matrix is the method
Frameworks alone don't get built; matrices do. Every goal is tagged to the frameworks that carry it — a filled marker where its core projects land, an open marker where related tactics support it, and governance goals like resident decision-making cutting across all three. From here the plan cascades: fifteen goals resolve into forty-three strategies, and strategies into roughly one hundred ten tactics, each anchored to a finding from the data or the engagement record.
That structure is traceable in both directions. Any tactic on any parcel — Missing Middle infill near Flanner House and Aspire House, calmed Neighborways and safer crossings, a completed Kessler "Diamond Necklace" greenway, a neighborhood CDC built to carry the capital forward — traces back through its strategy and goal to a theme residents named and a shift the data measured. And every commitment made in eight months of engagement traces forward to the ground where it lands. Nothing in the plan is unaccountable to a resident voice or a finding in the record — and nothing the evidence surfaced is left without an answer.
One corner, two horizons
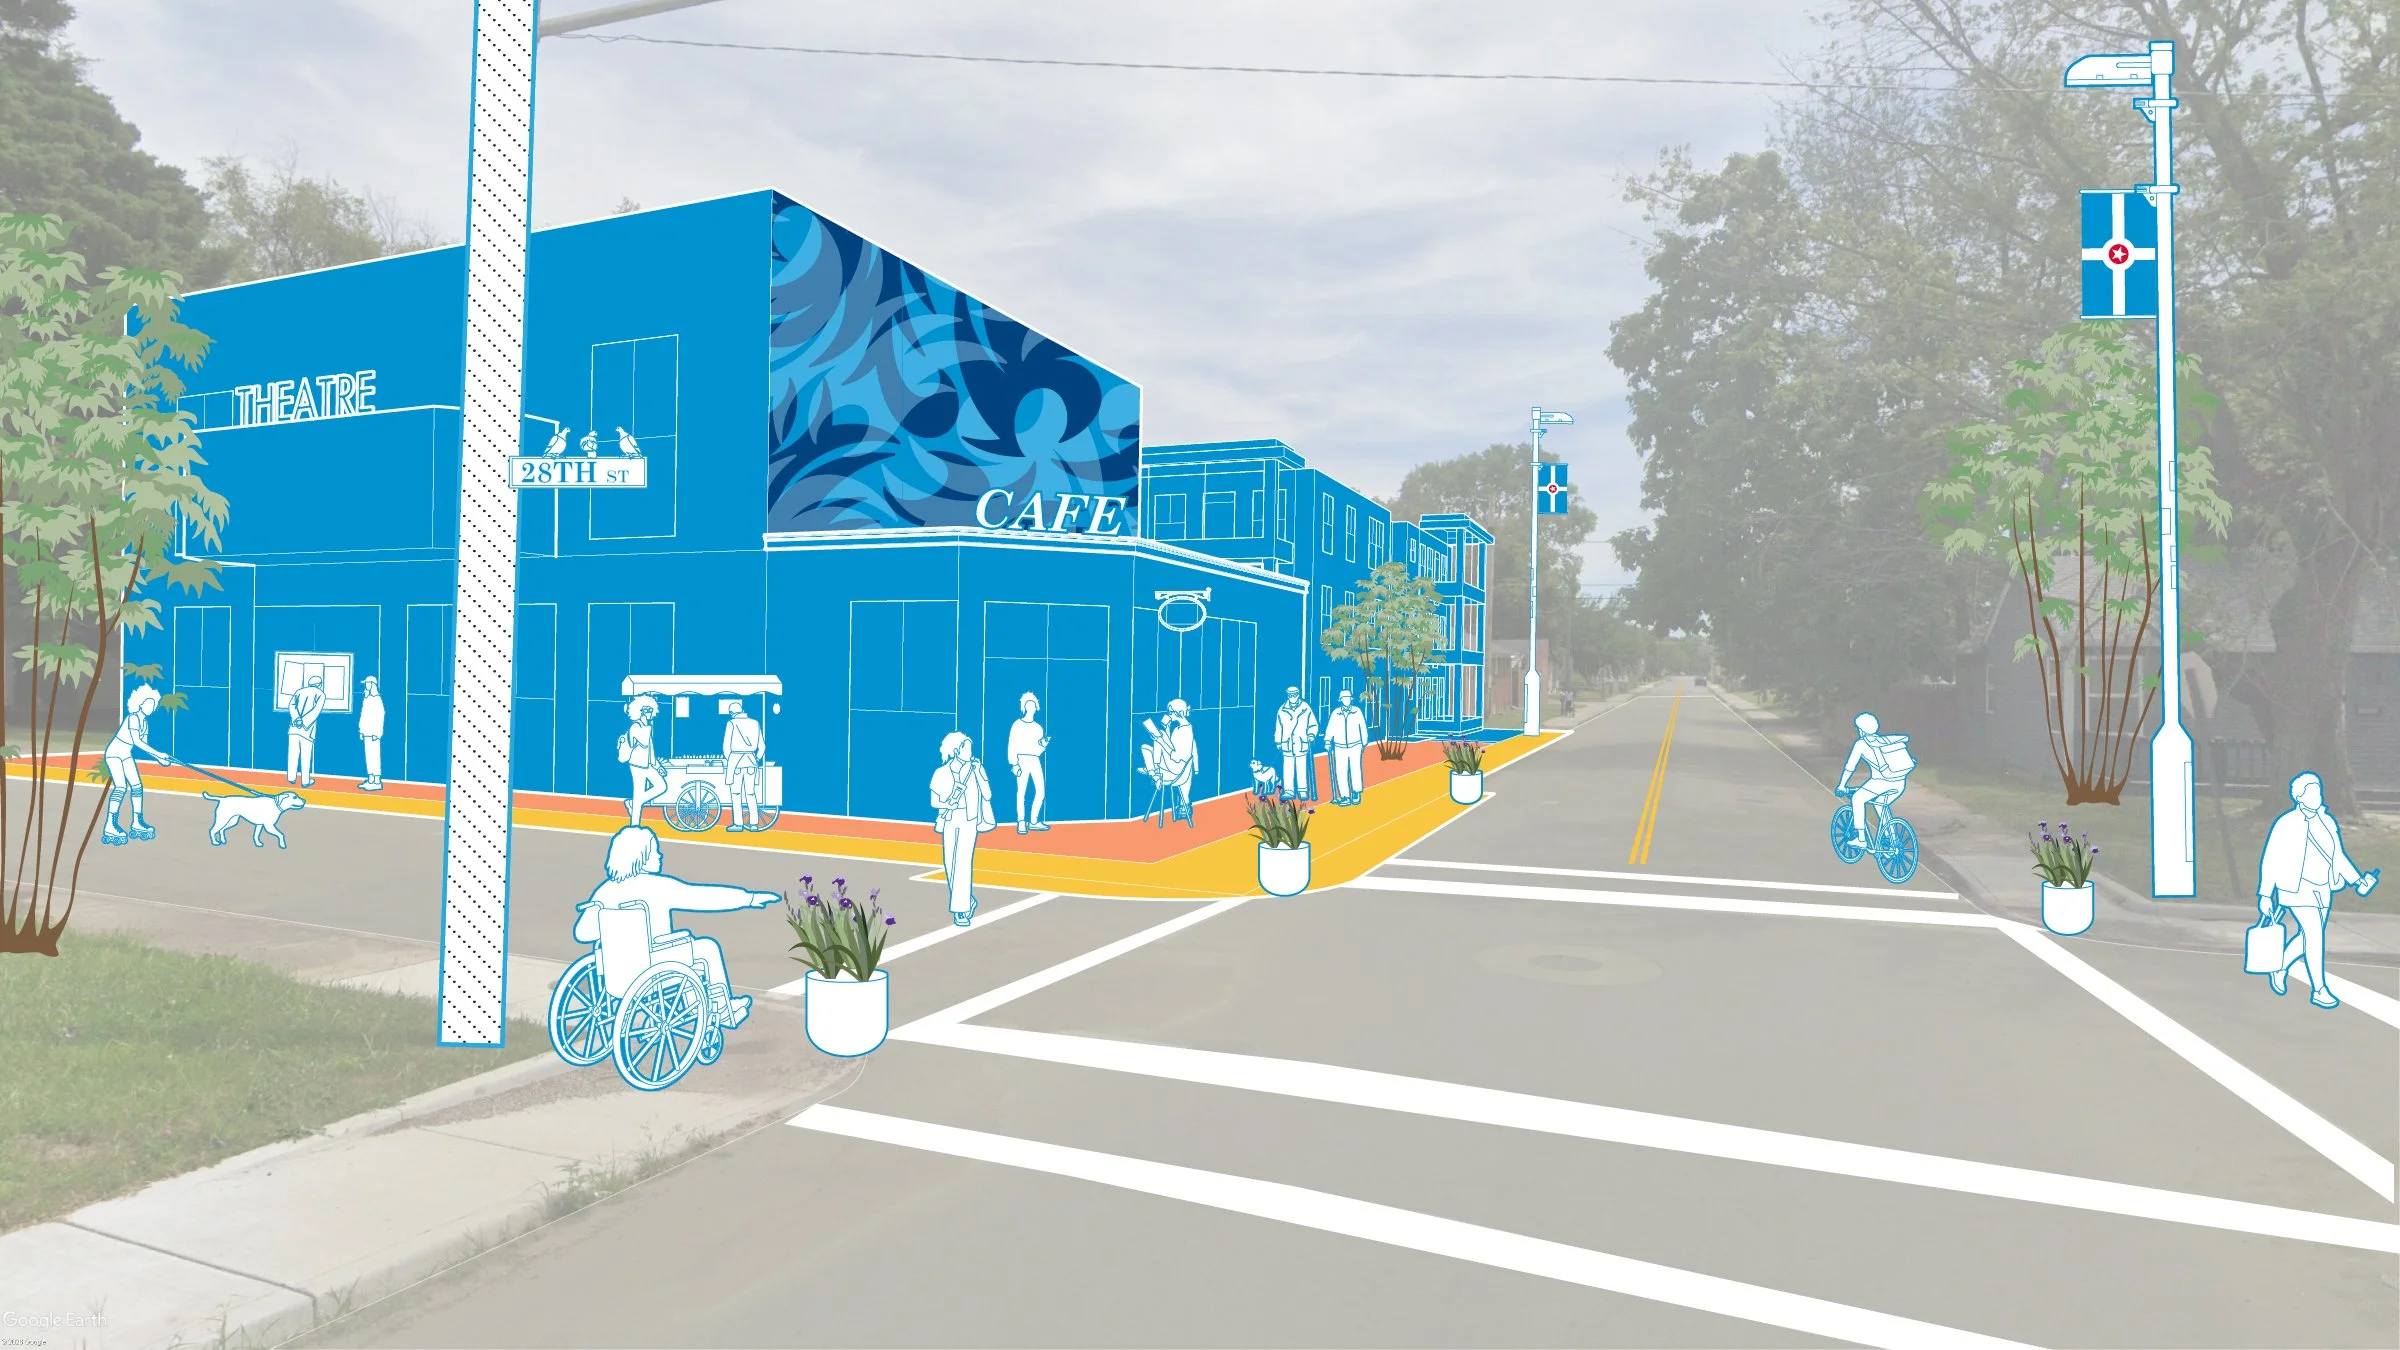
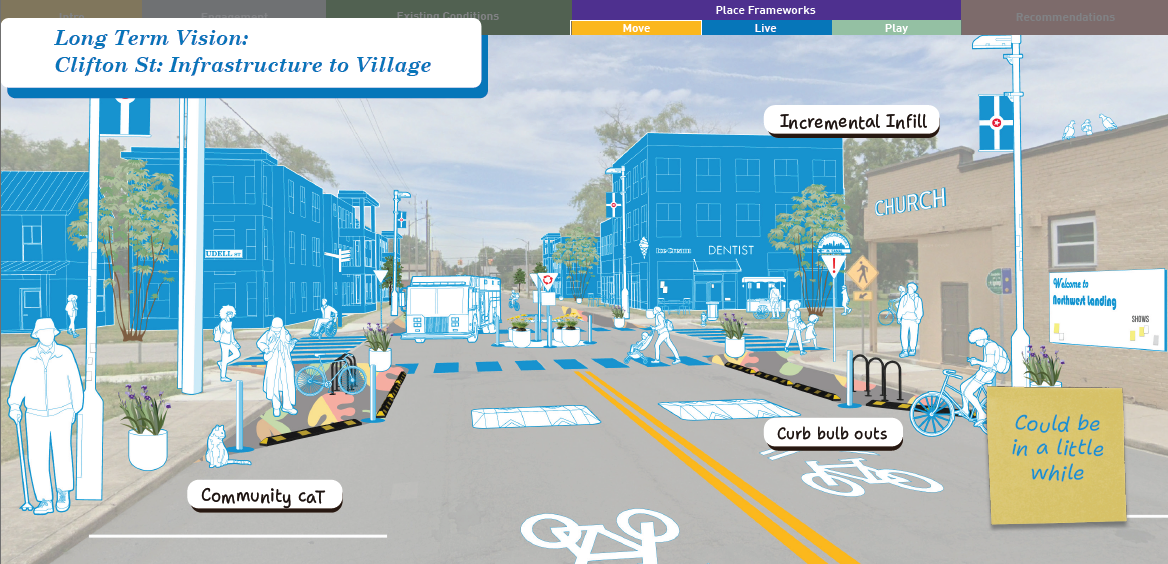
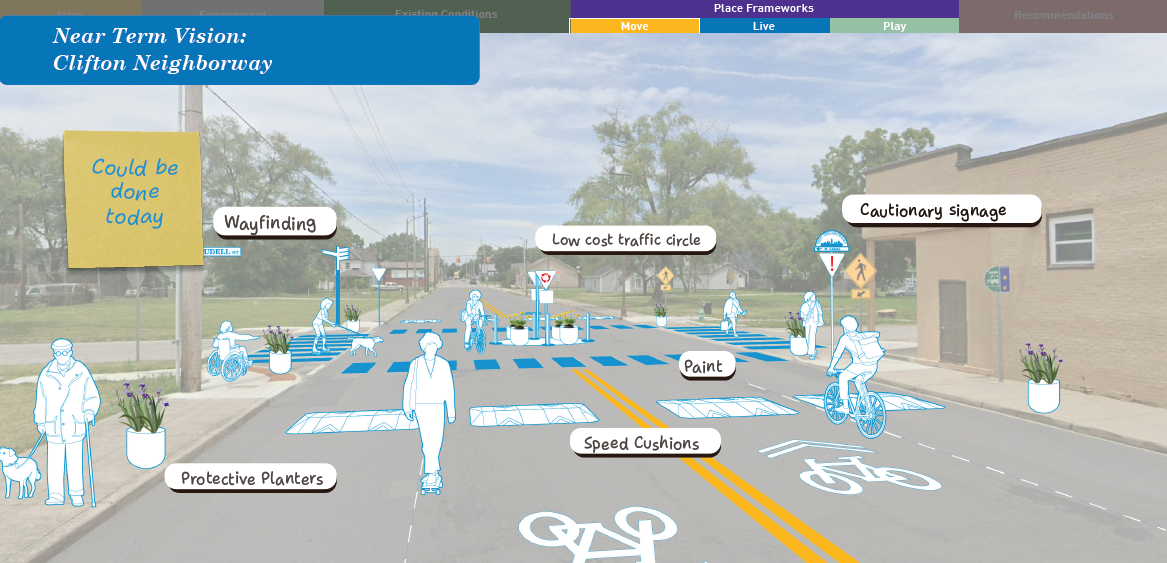
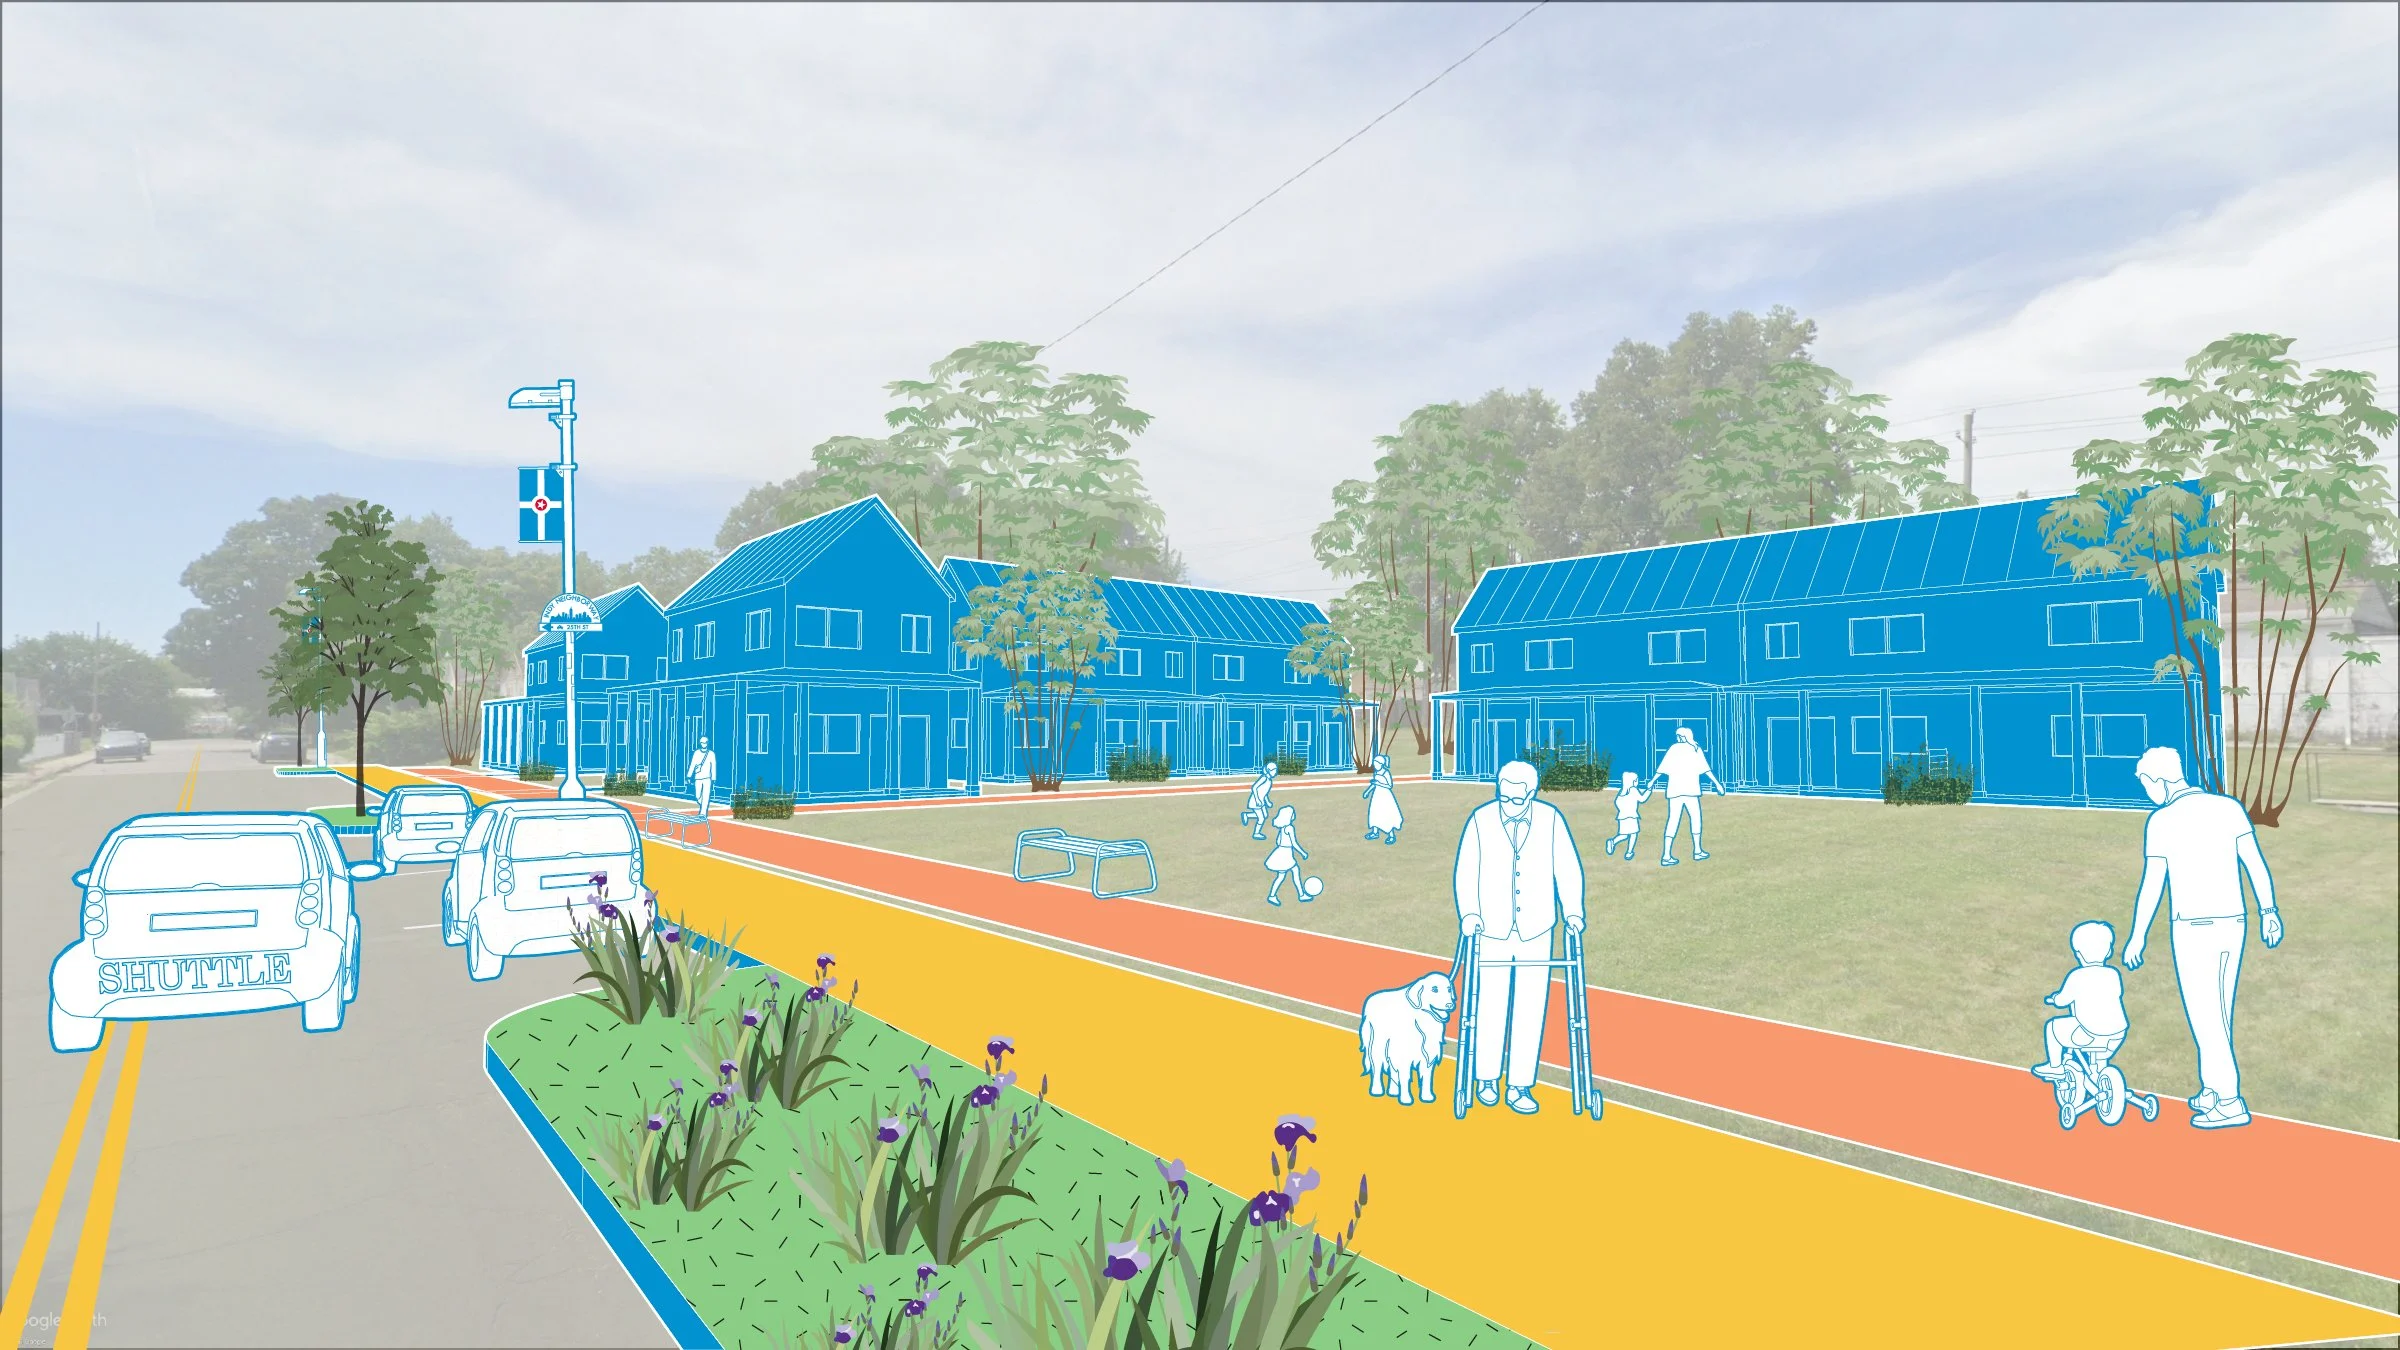
The connectivity analysis found excellent bones and uneven upkeep: one of the most connected street grids on the near-northwest side, undercut by missing sidewalks and unsafe crossings — in a neighborhood where nearly one in five households has no car. So every street recommendation is drawn twice: what the neighborhood can build next year with paint, planters, and partnerships, and what those first moves grow into. Drag across the Udell Street intersection to move between them.
 Short-term
Long-term
Short-term
Long-term
Udell Street: tactical calming first, permanent investment after.
Planning has failed this neighborhood before
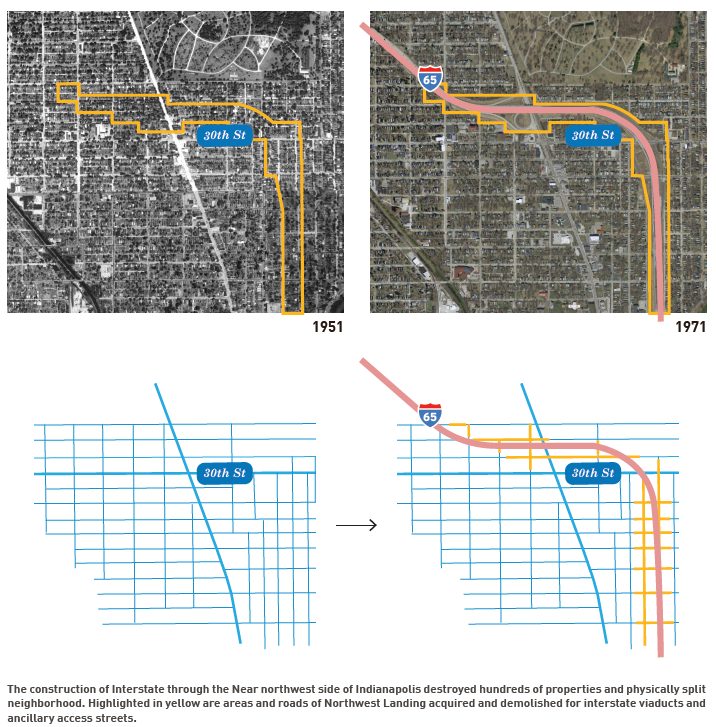
Like many inner-city neighborhoods across the United States, Northwest Landing has a complicated and fractured relationship with the highway that surrounds it. Interstate 65 was constructed in the late 1960s despite heavy community outcry from the predominantly Black neighborhood. Residents insisted the interstate be depressed, so the future infrastructure wouldn't physically rip the neighborhood in two.
Despite over 3,000 signatures and a plea to then-Governor Roger Branigin, the state built I-65 as a fully elevated roadway through the United Northwest area. Planted atop tall grass viaducts, the interstate acts as both a figurative and an actual wall between the neighborhood and Midtown Indianapolis to the east.
The data says the pattern isn't finished: the community that lost its fight against the interstate has lost nearly a thousand Black residents since 2010, most of them in the last four years. But the same record shows what endured — one of the densest networks of faith institutions in the city, Kessler's greenway system, and the 1898 Riverside Branch, the Indianapolis Public Library's first. That history — and that arithmetic — is why this plan listens first, measures honestly, builds around what residents kept alive rather than over it, and makes growth without displacement its test, not its tagline.
Project Details
- Client
- Aspire Higher Foundation
- Location
- Indianapolis, Indiana
- Size
- ~435 Acres · 2,450 Residents
- Engagement
- 196+ Participants Over 8 Months
- Status
- Completed
Key Services
- Participatory Surveys, Interviews & Focus Groups
- Graphic Design & Visual Storytelling
- Quality of Life Planning
- Subarea / Neighborhood Planning
- Urban Design & Concepts
- Implementation & Action Steps
- Land-to-Assessed-Value Analysis
- Missing Middle Infill Scenarios