
Community Engagement · Urban Planning
Mass Ave Next Vision Plan
Indianapolis, Indiana

What
Mass Ave has become downtown Indianapolis's home for arts, culture, food, shopping, and more. But success brings pressure — and without a shared plan, development happens to a district rather than for it. Commissioned by the Mass Ave Cultural Arts District (MACAD) in partnership with the Indianapolis Foundation, the Mass Ave Next District Vision Plan is a year-long strategic framework built to ensure that what makes Mass Ave extraordinary doesn't get lost in what comes next. It asks a deceptively simple question: how does a cultural district stay cultural?
Our process moves through three phases — Discovery, Opportunity Identification, and Thinking Big — synthesizing spatial analysis, stakeholder input, and community engagement into a framework organized around four strategic themes: Experience & Use, Neighborhood Structure, Mobility, and Catalytic Sites. But the physical is only half the equation. Running alongside them are guiding themes — the sociophysical layer that asks not just how do we get there, but what do our decisions say about who we are?
Reading the district · Existing conditions
The boom built the district. It won't carry the next decade.
Proformus read the Mass Ave Cultural Arts District as one recursive system — people make place, place shapes people — pairing four vintages of Census data, parcel-level assessment and fiscal-productivity analysis, commute flows, and visitation records with engagement built for analysis: hundreds of community comments geocoded to the block they reference and scored by sentiment and topic, so opinion can be mapped like any other layer. Through the 2010s, that record reads like a triumph: population up 55%, housing up 74%, and an extraordinary concentration of the 25-to-34-year-olds other districts spend a decade courting.
Then, around 2020, the engine stalled. Population has drifted slightly down since. Construction collapsed from the 2010s pace. Mass Ave became the only comparison geography — against Broad Ripple, Fountain Square, and the county — where unemployment rose after the pandemic. Real incomes gave back their gains while rents climbed 25% and ownership stock actively shrank; vacant storefronts became the community's single most-cited concern; and the district began pulling apart, one side losing 15% of its population while the other grew 19%. The trajectory that built modern Mass Ave has stopped producing — and coasting on the 2010s model won't restart it.
The engine, and the stall
Housing units built, by period
One in three units in the district was built in the last fourteen years — and almost none in the last four. Growth didn't slow. It stopped.
The evidence · Existing Conditions Report, Part 1
Four figures from the report carry the argument. The population is no longer a pyramid but a top: three five-year age bands hold more than half the district, the under-five cohort fell by two-thirds, and the residents who were in their fifties and sixties in 2010 have not been replaced. Incomes, rents and home values rose together until 2020, then parted. Unemployment is the only line among the peers still climbing. And two in three households are one person — the housing produced the population it was built for. Click any figure to read it full-size.
What we're hearing · 400+ voices
The data says what changed; the community says what matters. Beginning with the Map Your Mass kickoff in February 2026, more than 400 people weighed in — on an eight-foot map of the Avenue, an online survey, a pop-up parklet build, and one-on-one conversations — and every kickoff comment was geocoded to the block it references and scored for sentiment and topic. What people love is concentrated in two assets, a dense restaurant economy and a walkable street. What worries them is exactly what threatens those assets: empty storefronts, missing green space, and a brand that has grown larger than the experience.


On the map · Maptionnaire survey
The Maptionnaire map survey puts that read on the record the same way the parcel data is: tied to place. Drag through the results — each maps a piece of what the community wants onto the blocks where they want it. Click any card to read it full-size.
What we hold onto · Guiding principles
Distilled together, the record and the voices become the plan's guiding principles — the yardstick every move in every framework is measured against. Not decoration on the plan, but the test each recommendation has to pass: does this decision say who the district wants to be? Flip through the working spreads — click any page to read it full-size.
A stalled district needs a different strategy than a booming one — and the analysis points to where the next decade's value actually sits: in the 23% of the district built below half its potential, the 10% paved as parking, and the gap between a brand and an experience. Proformus resolved the record into four place frameworks, each converting a measured challenge into a site-specific opportunity, each measured against the guiding principles above — and each grounded by the geocoded engagement record and the Maptionnaire map survey now in the field, which ties the draft principles to the specific blocks residents named.
Four frameworks, built from the evidence
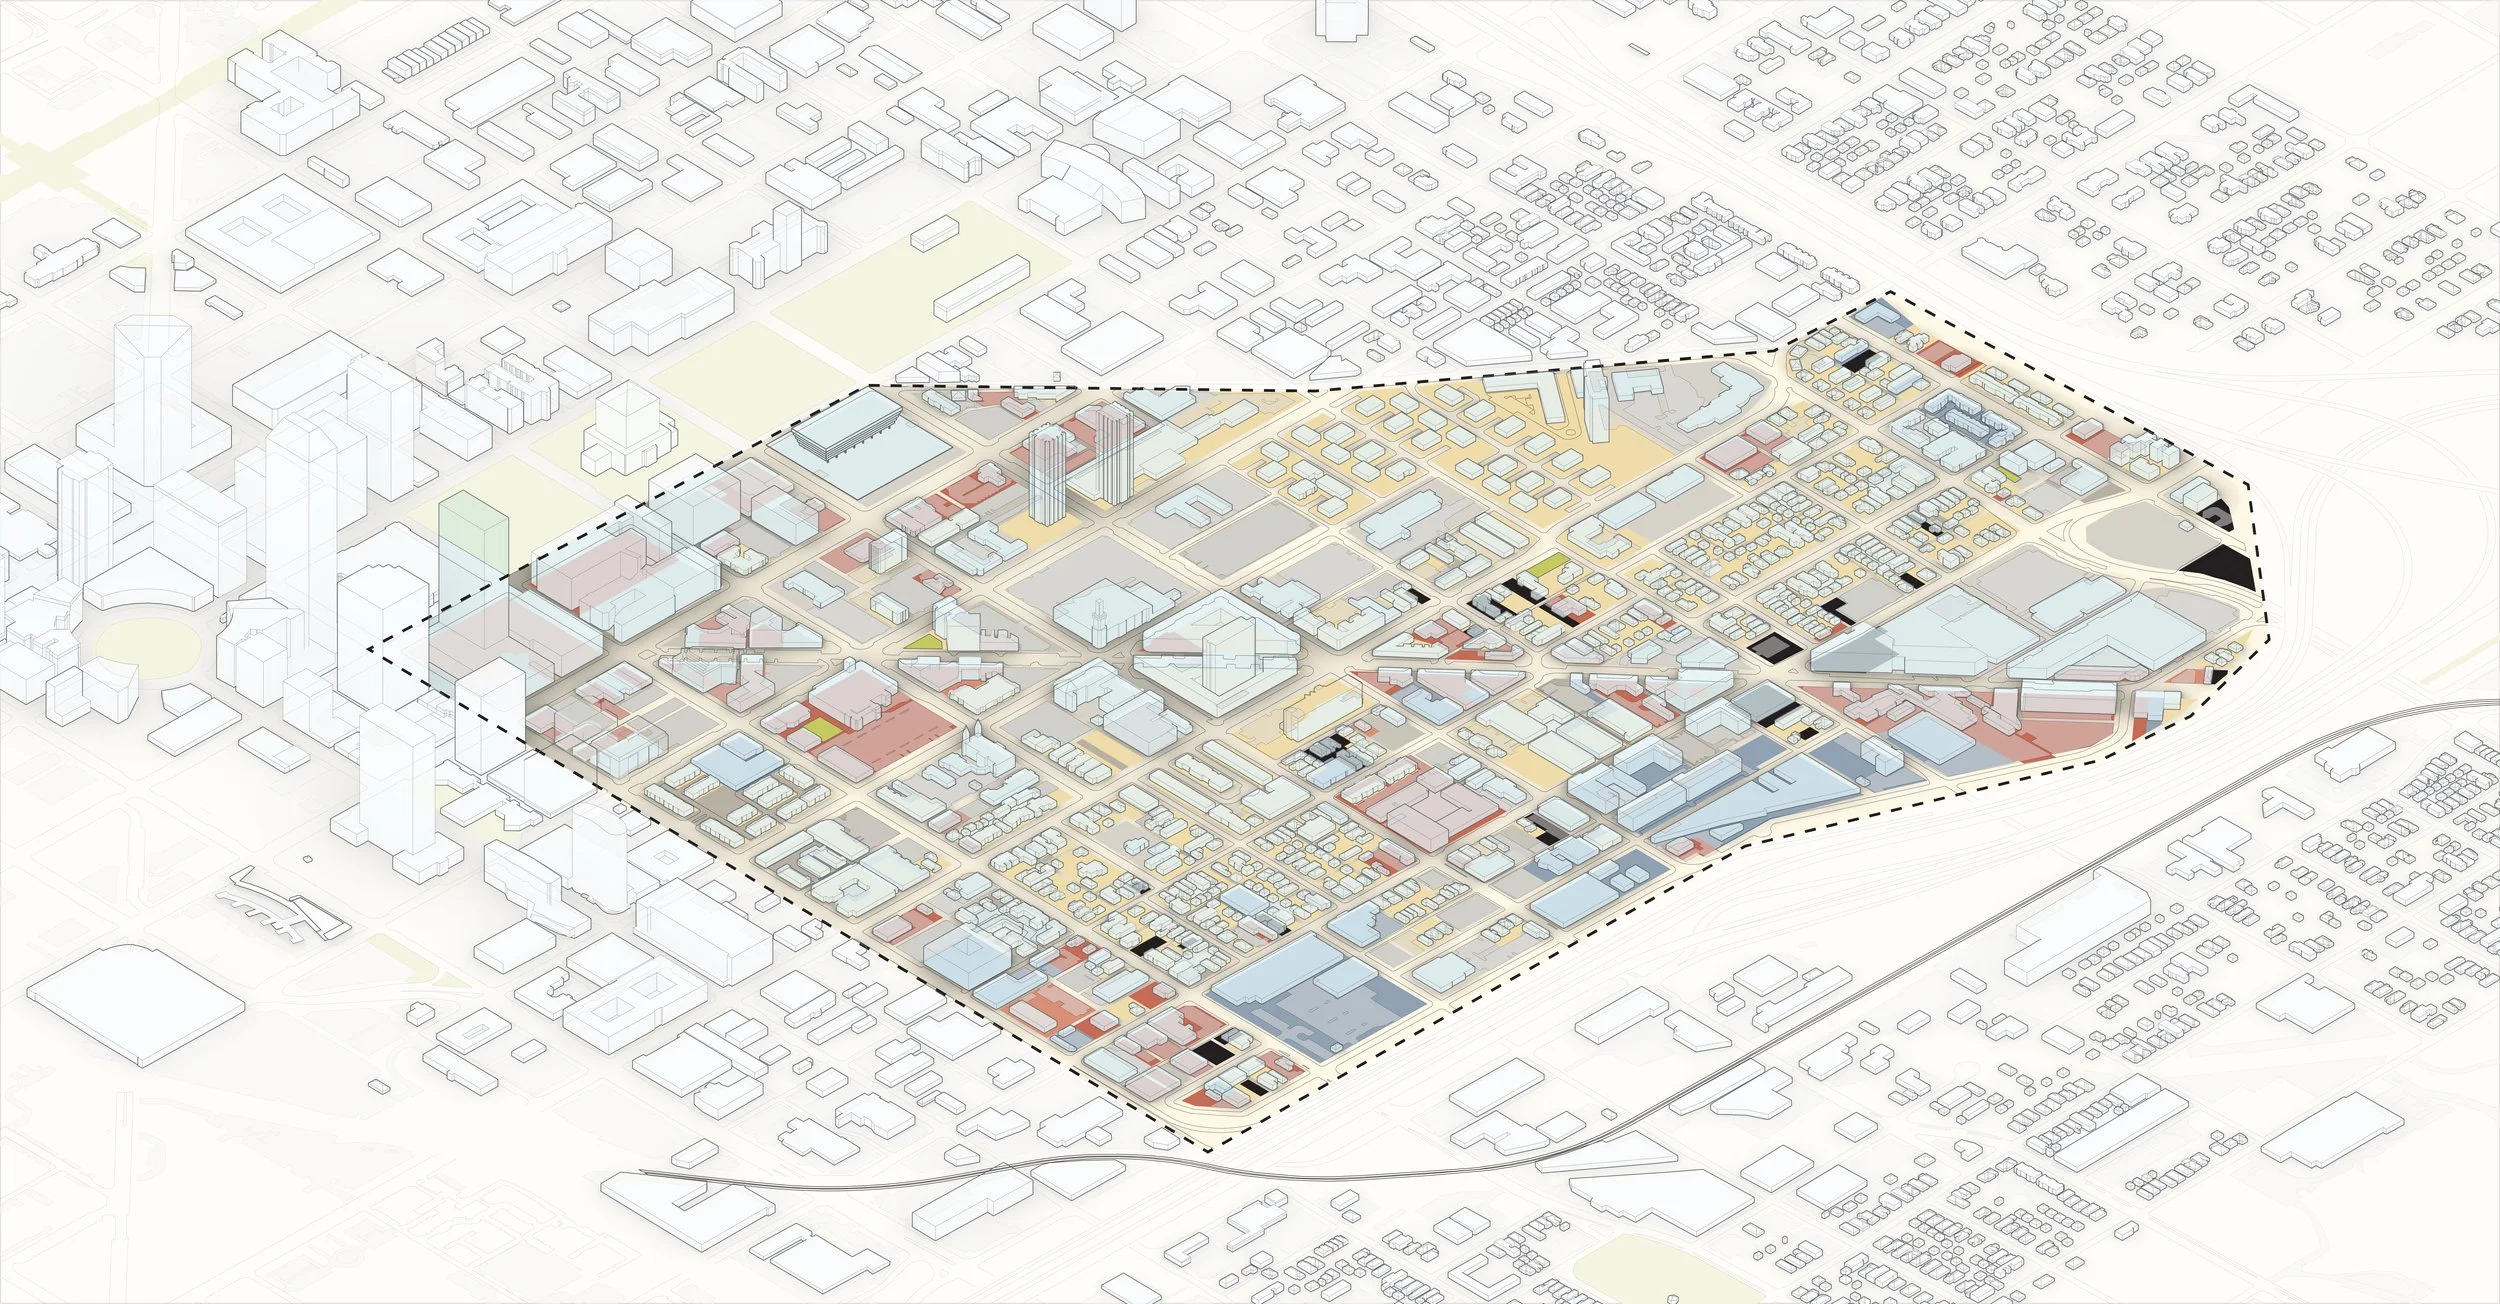
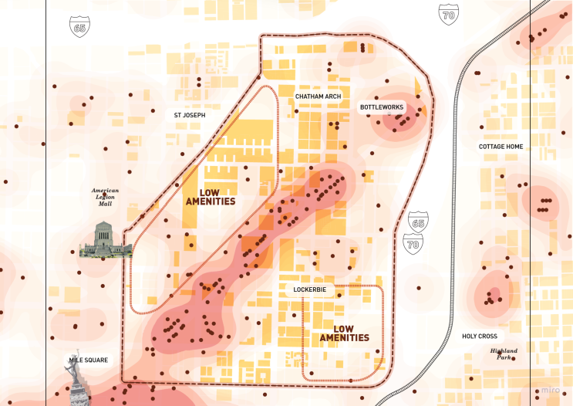
Inconsistent investment becomes an activated market. Infill, housing mix, and ground-floor activation targeted to the parcels where value-per-acre lags — shaped as fabric repair inside the 70% of the district that's historically protected, with fiscal-productivity math attached to every move.
On the map: respondents name Fort Wayne Ave the district's opportunity spot, and the Marathon / Roberts Park / Salvation Army area drew the most calls for change.
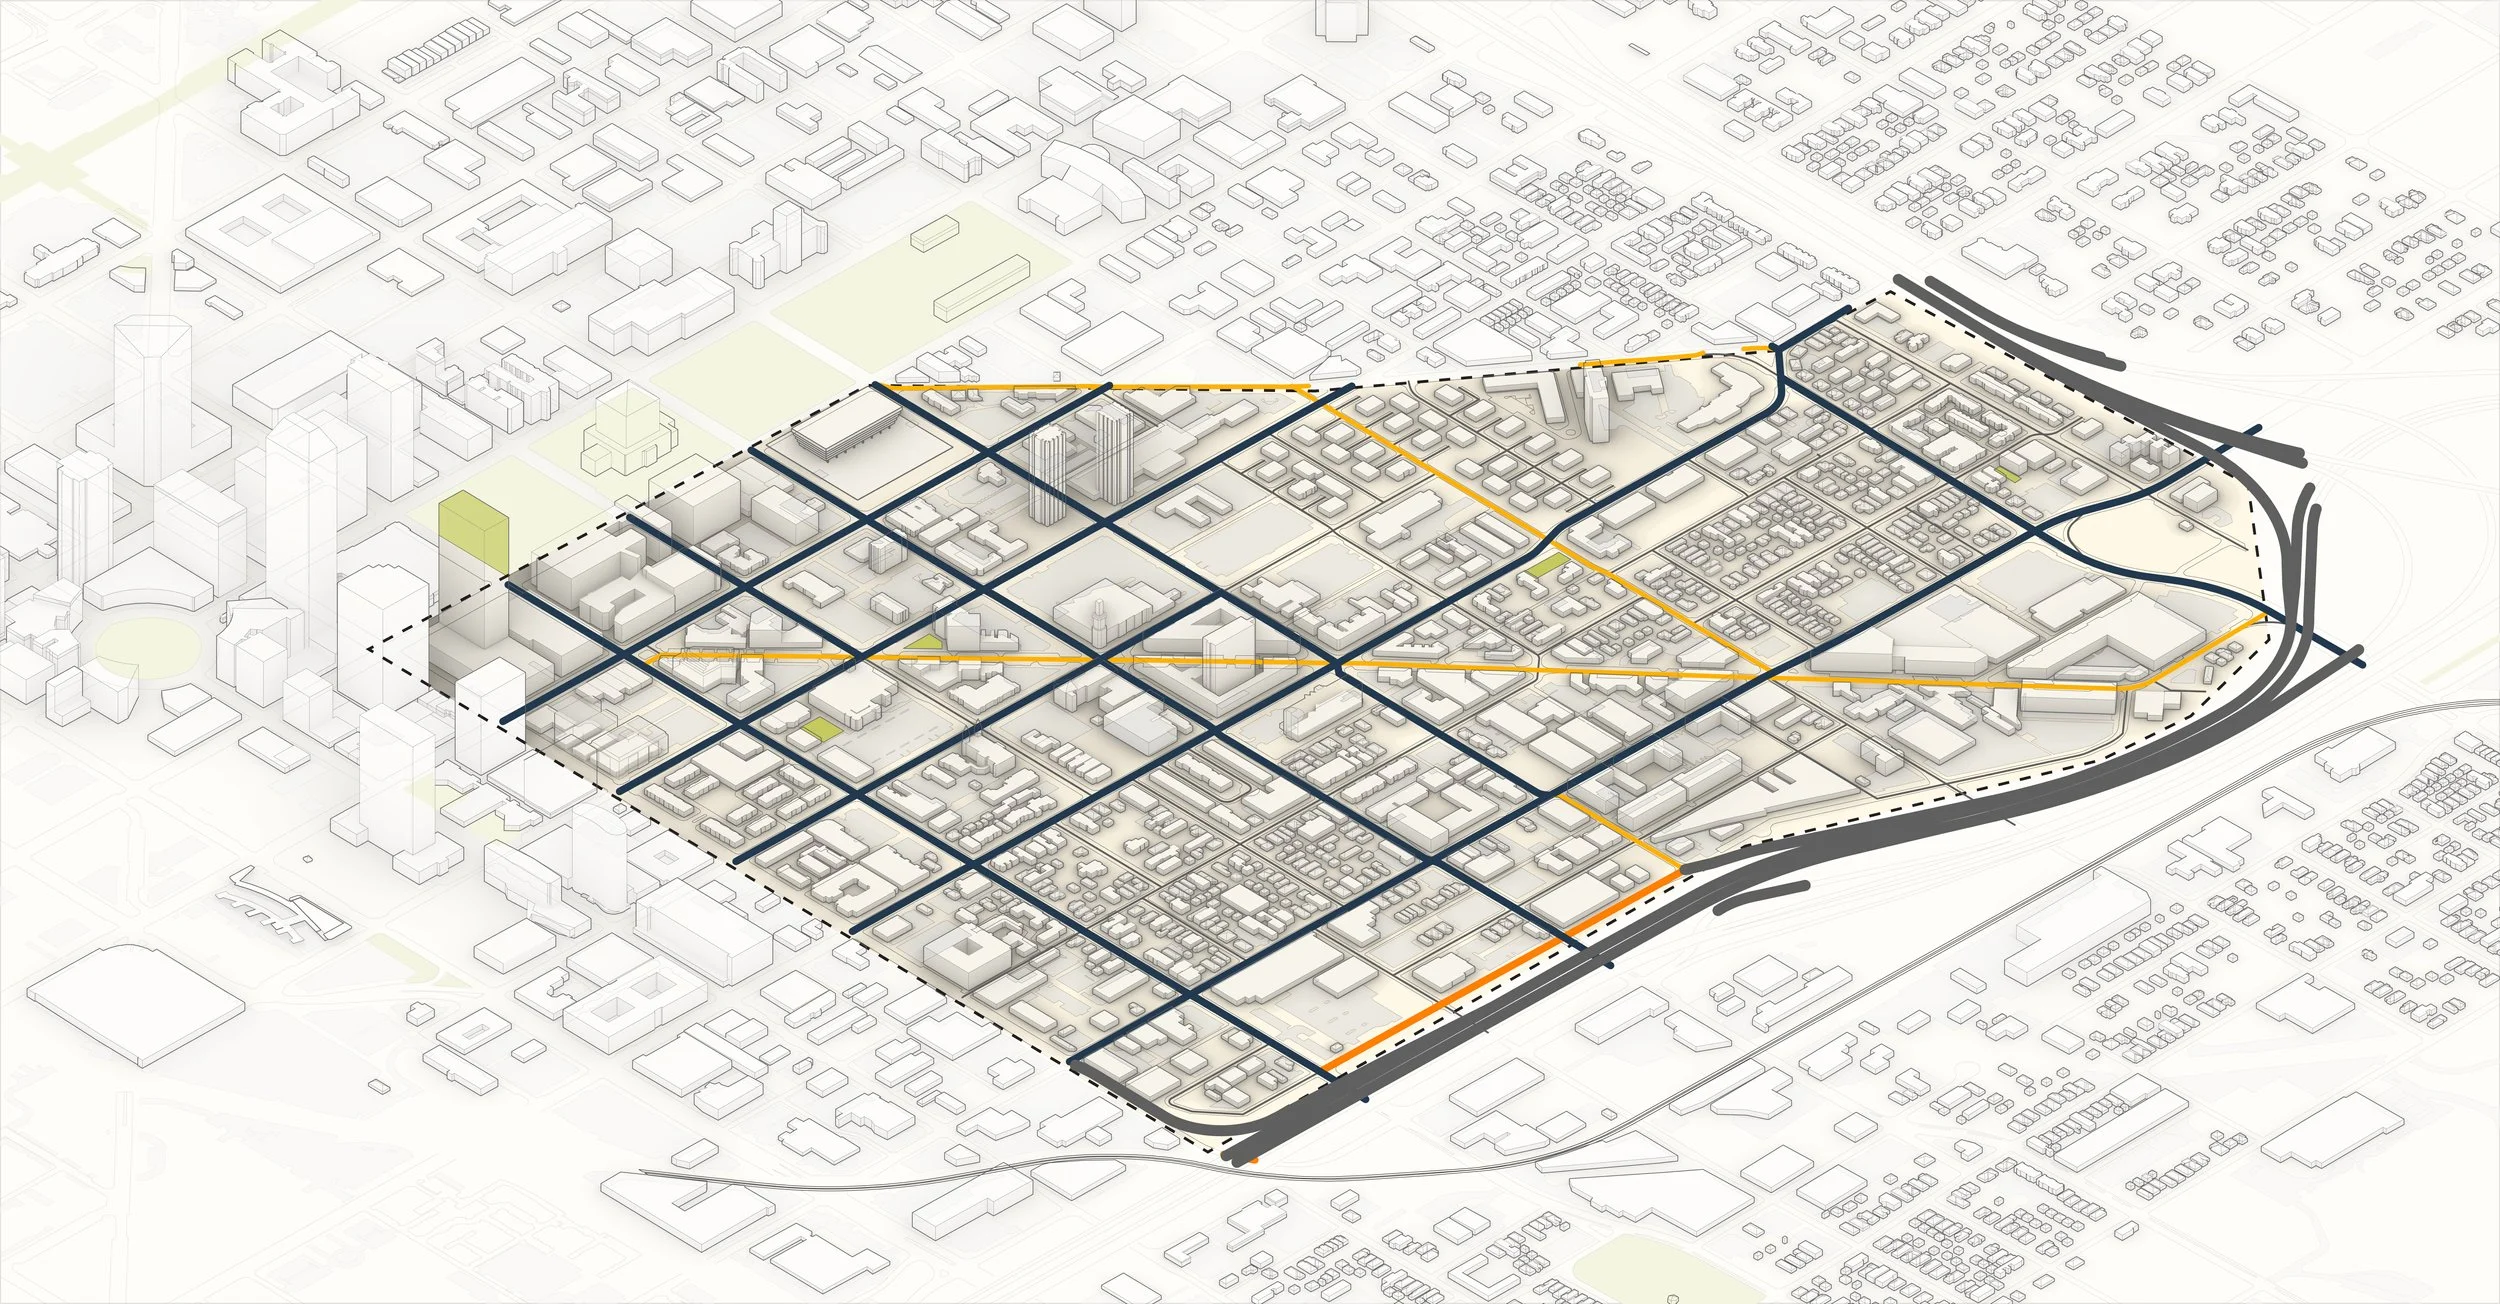
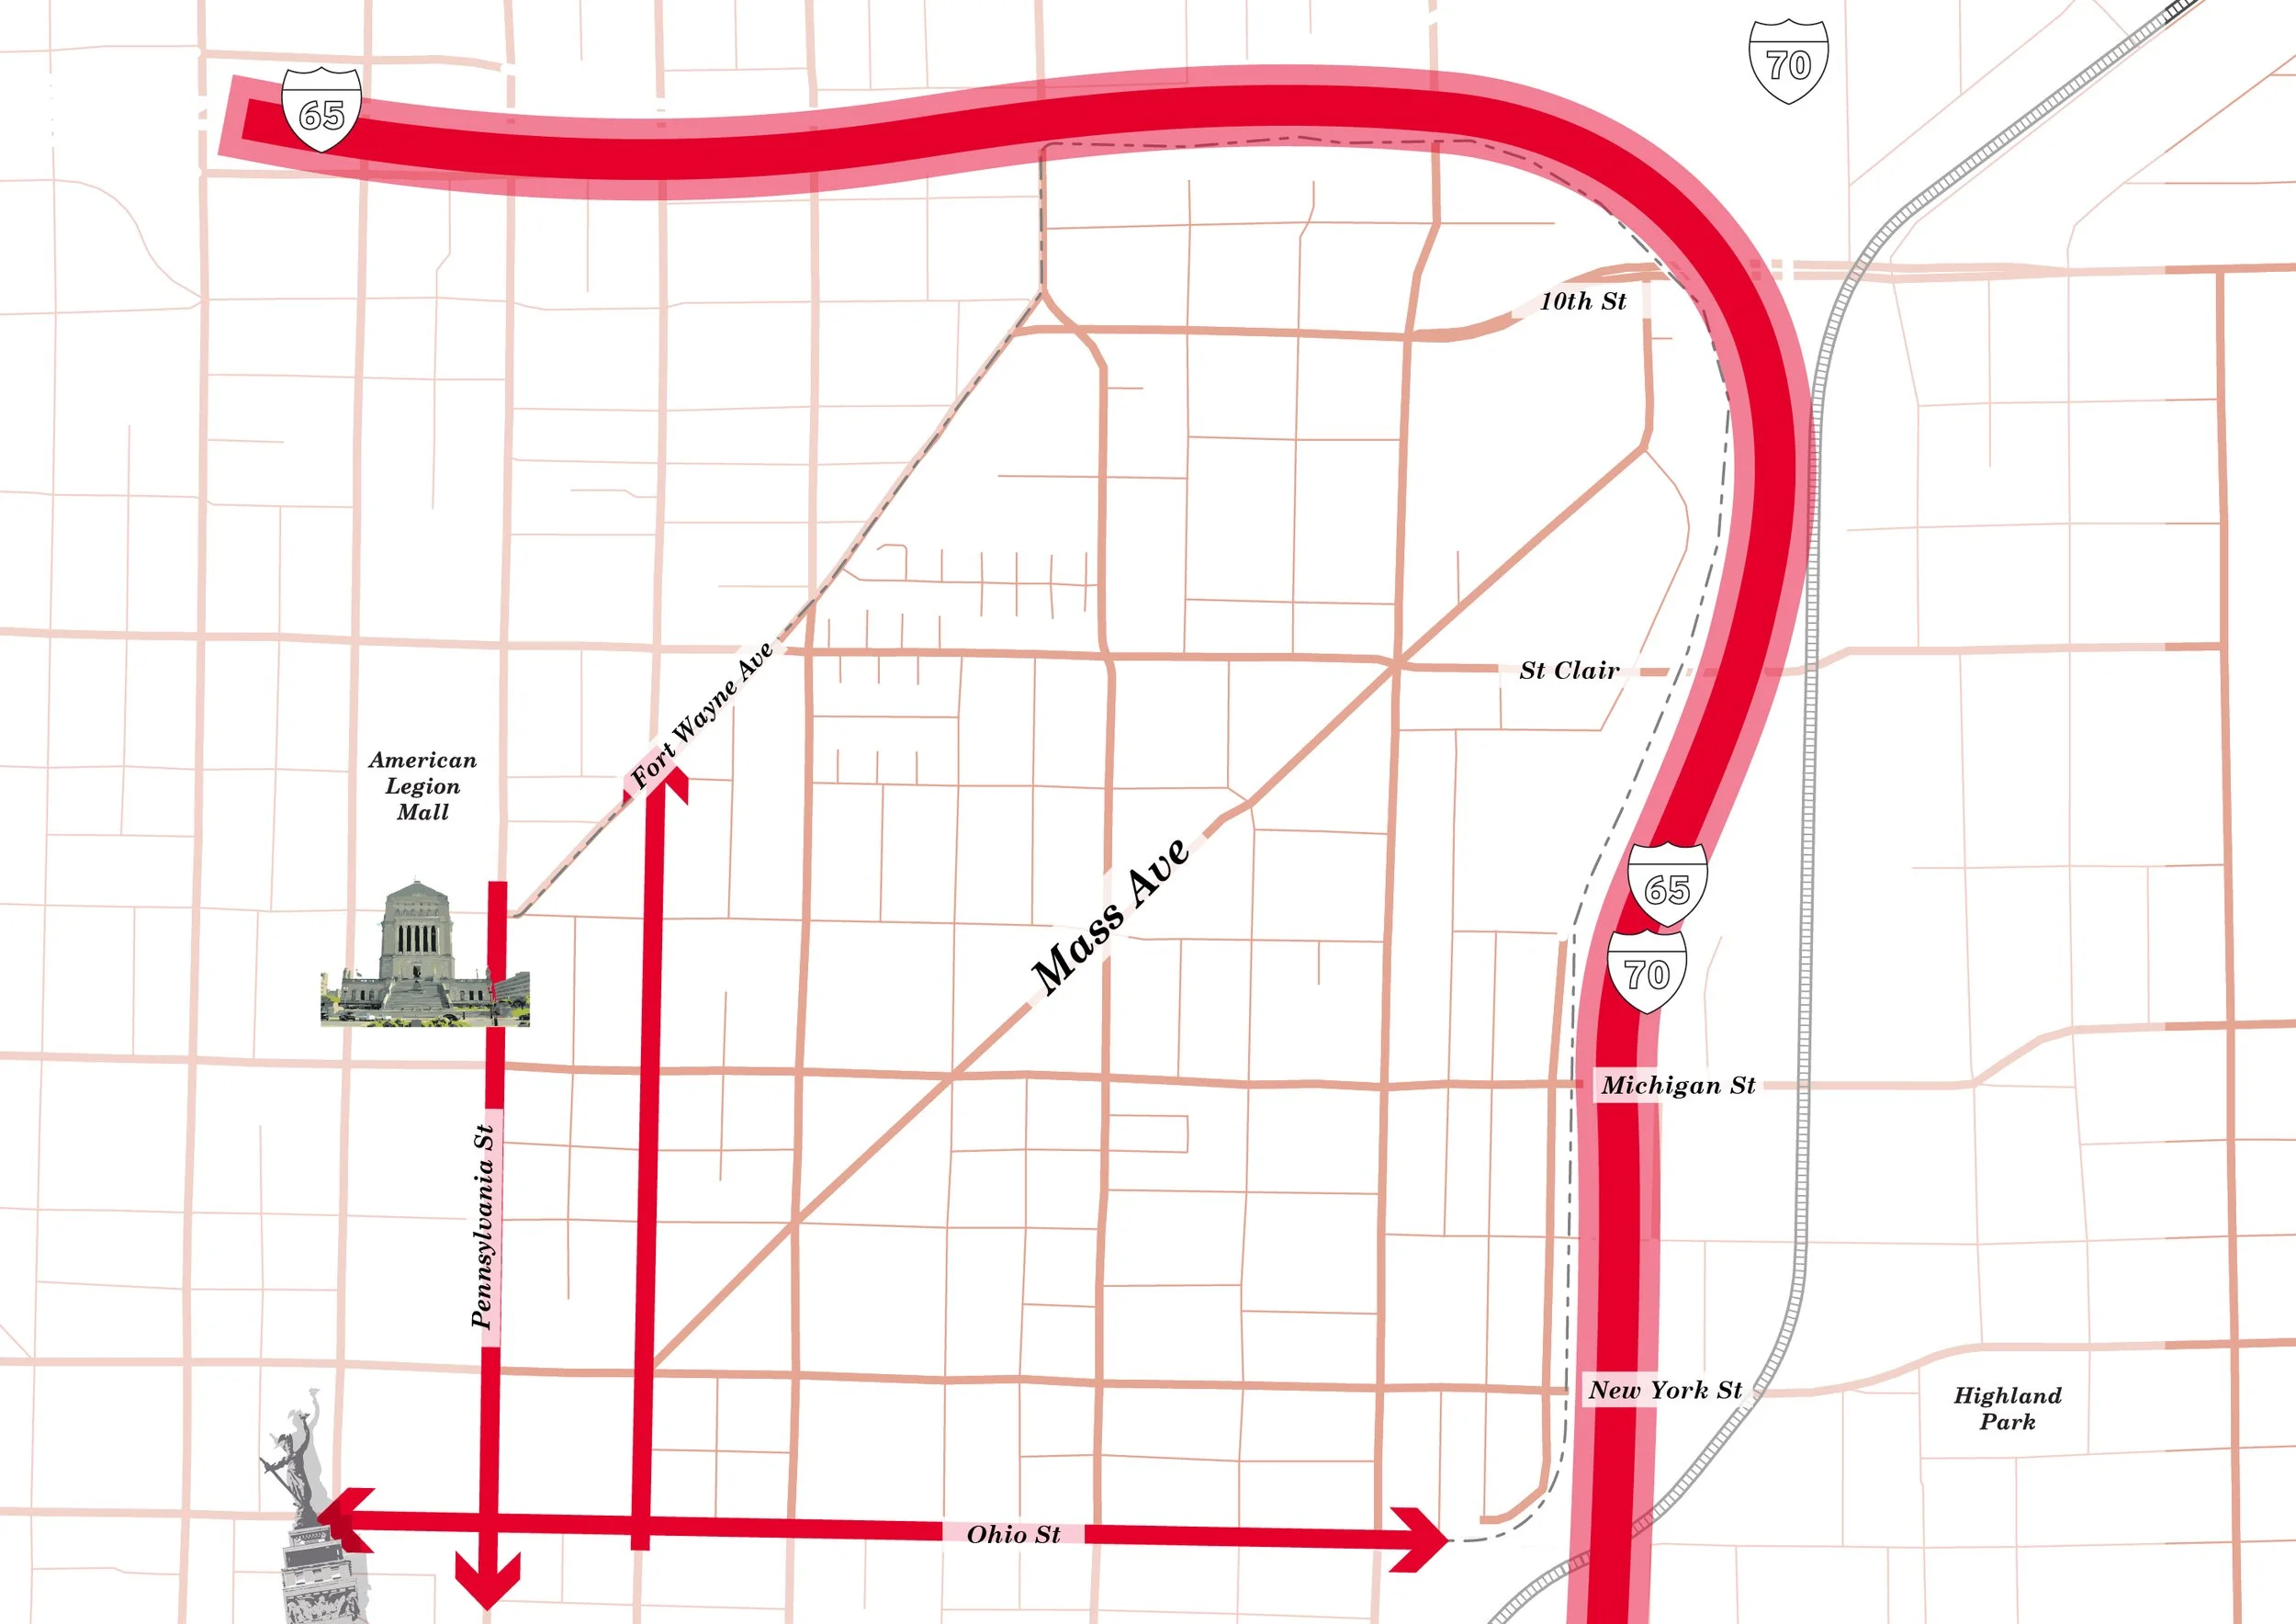
Land UseBarriers become better connection. Safer six-way intersections, real links under the highway, and activity extended along the trail — so movement through the district is as good as the destination, and growth on one side can reach the other.
On the map: the College/Mass intersection tops improvement requests, and activity gaps cluster along the Cultural Trail south of the Ave and north of the trail.
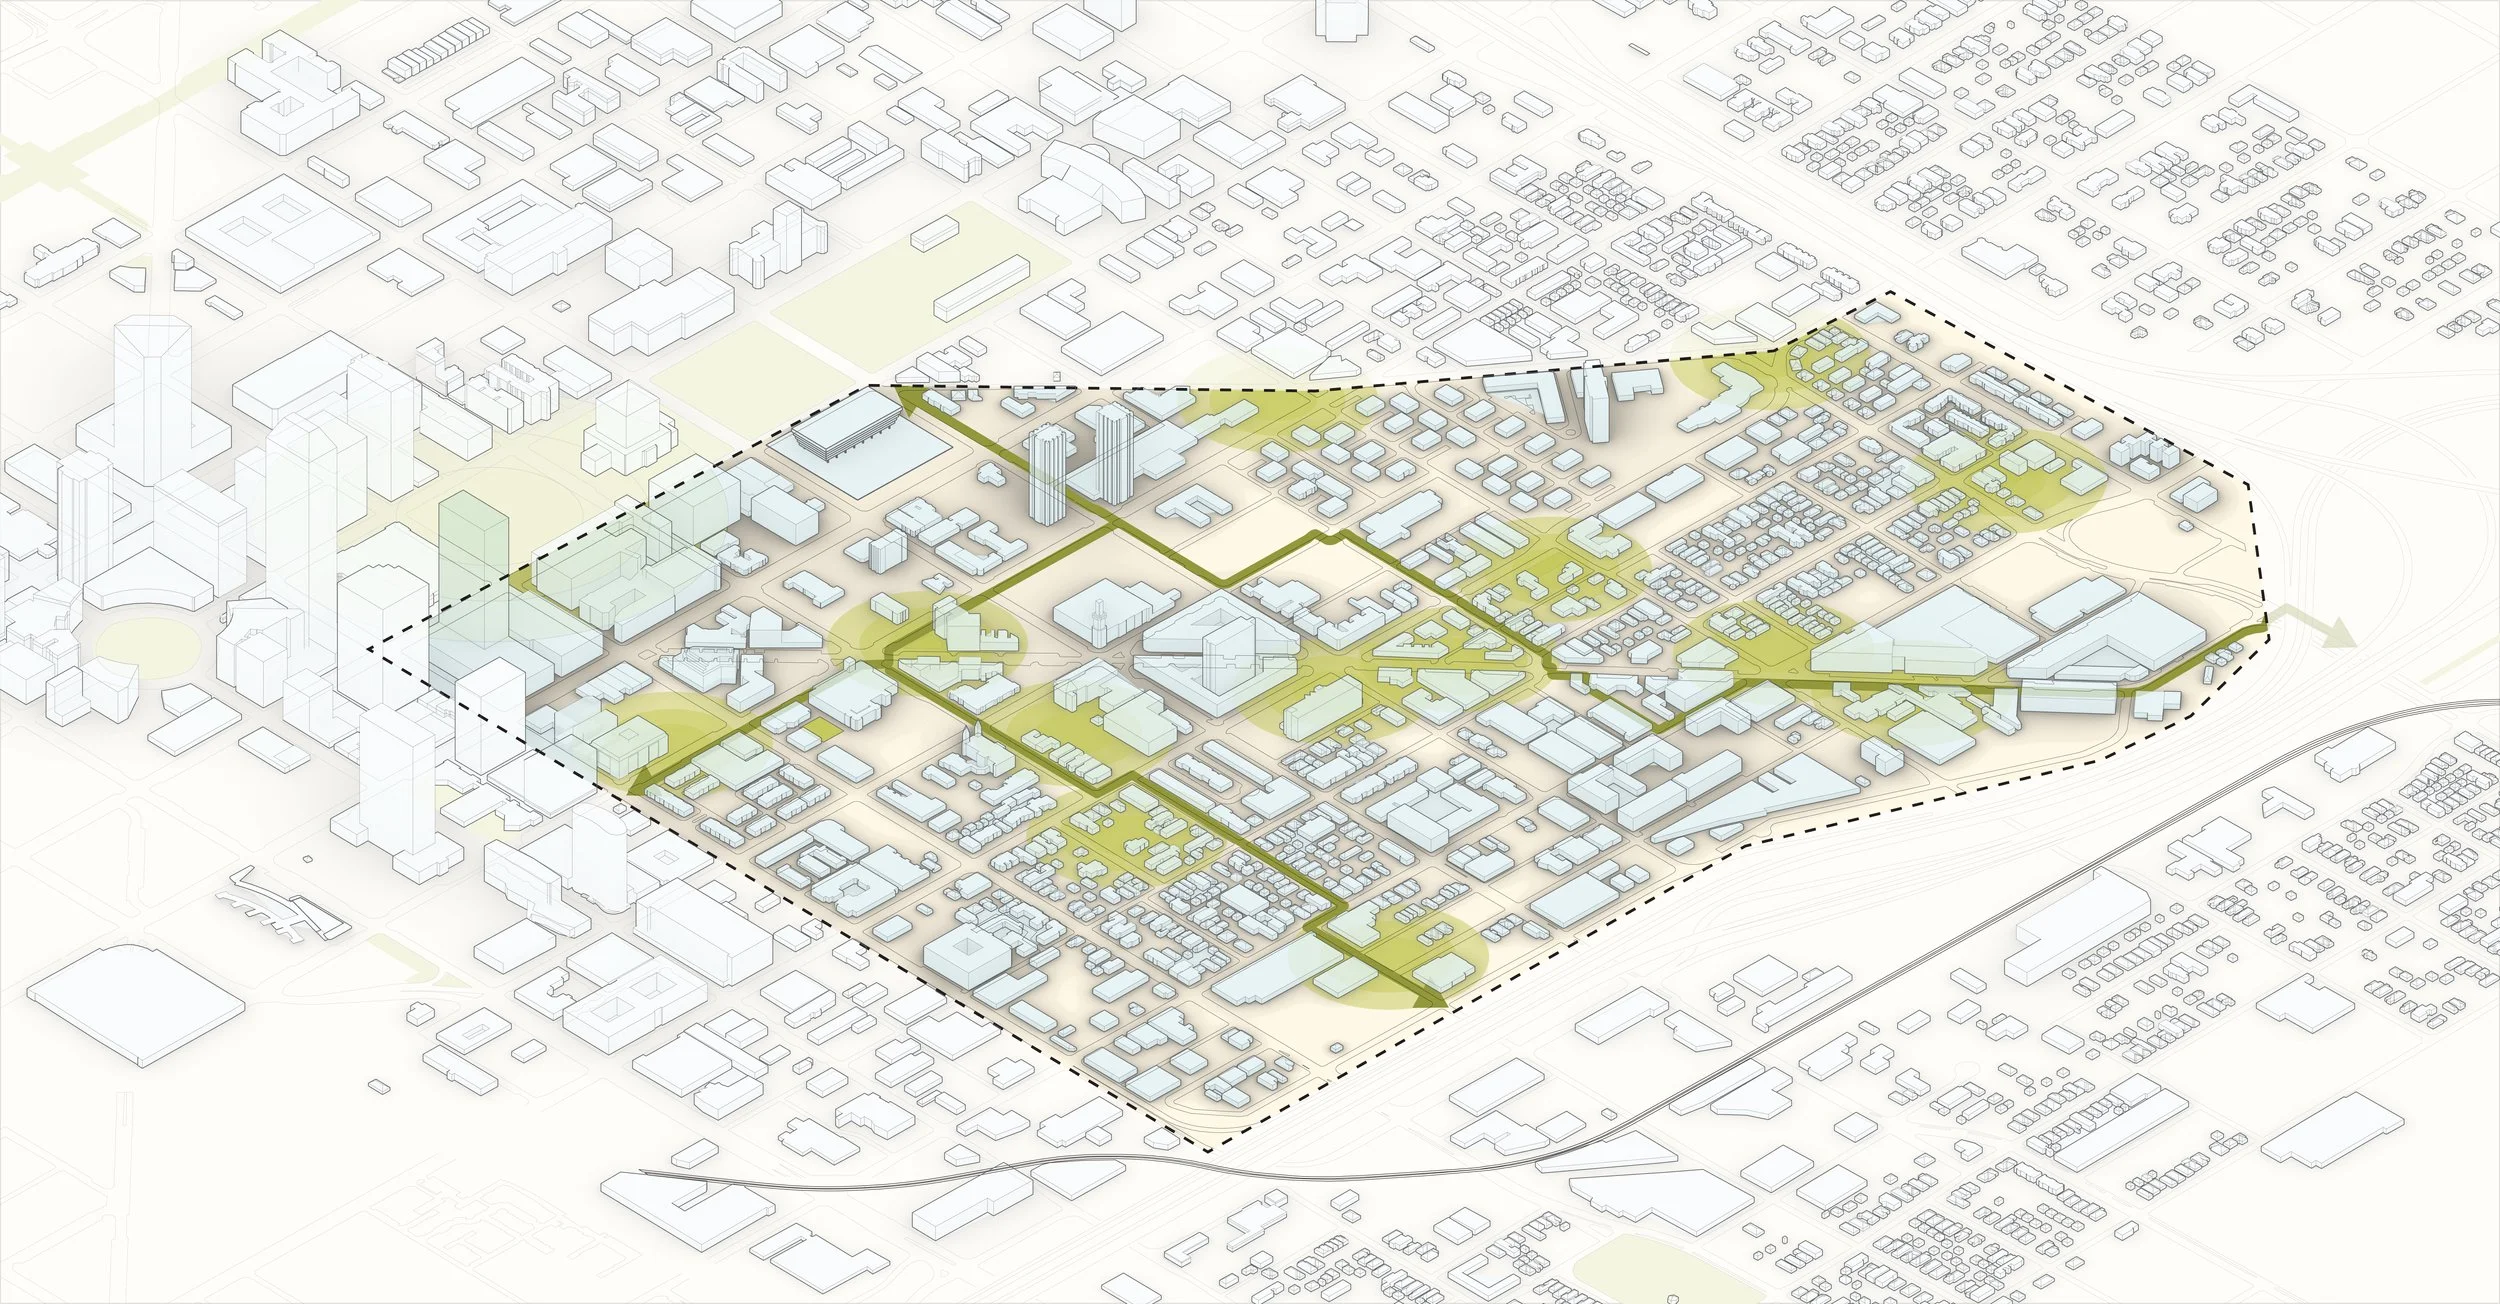
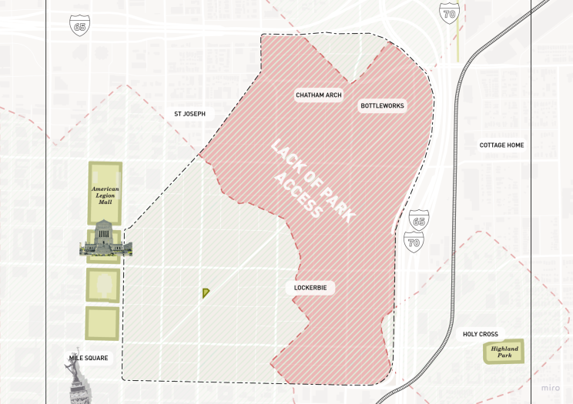
ConnectivityLack of recreation becomes created play. Greenspace over empty parking, third places sized for the households that actually live here, and underworked land converted into the commons the community asked for — the quality-of-life investment that is also the retention lever.
On the map: hangout gaps cluster on the northwest and southern edges, while comfort concentrates at Bottleworks and the 600 block — the model to extend.
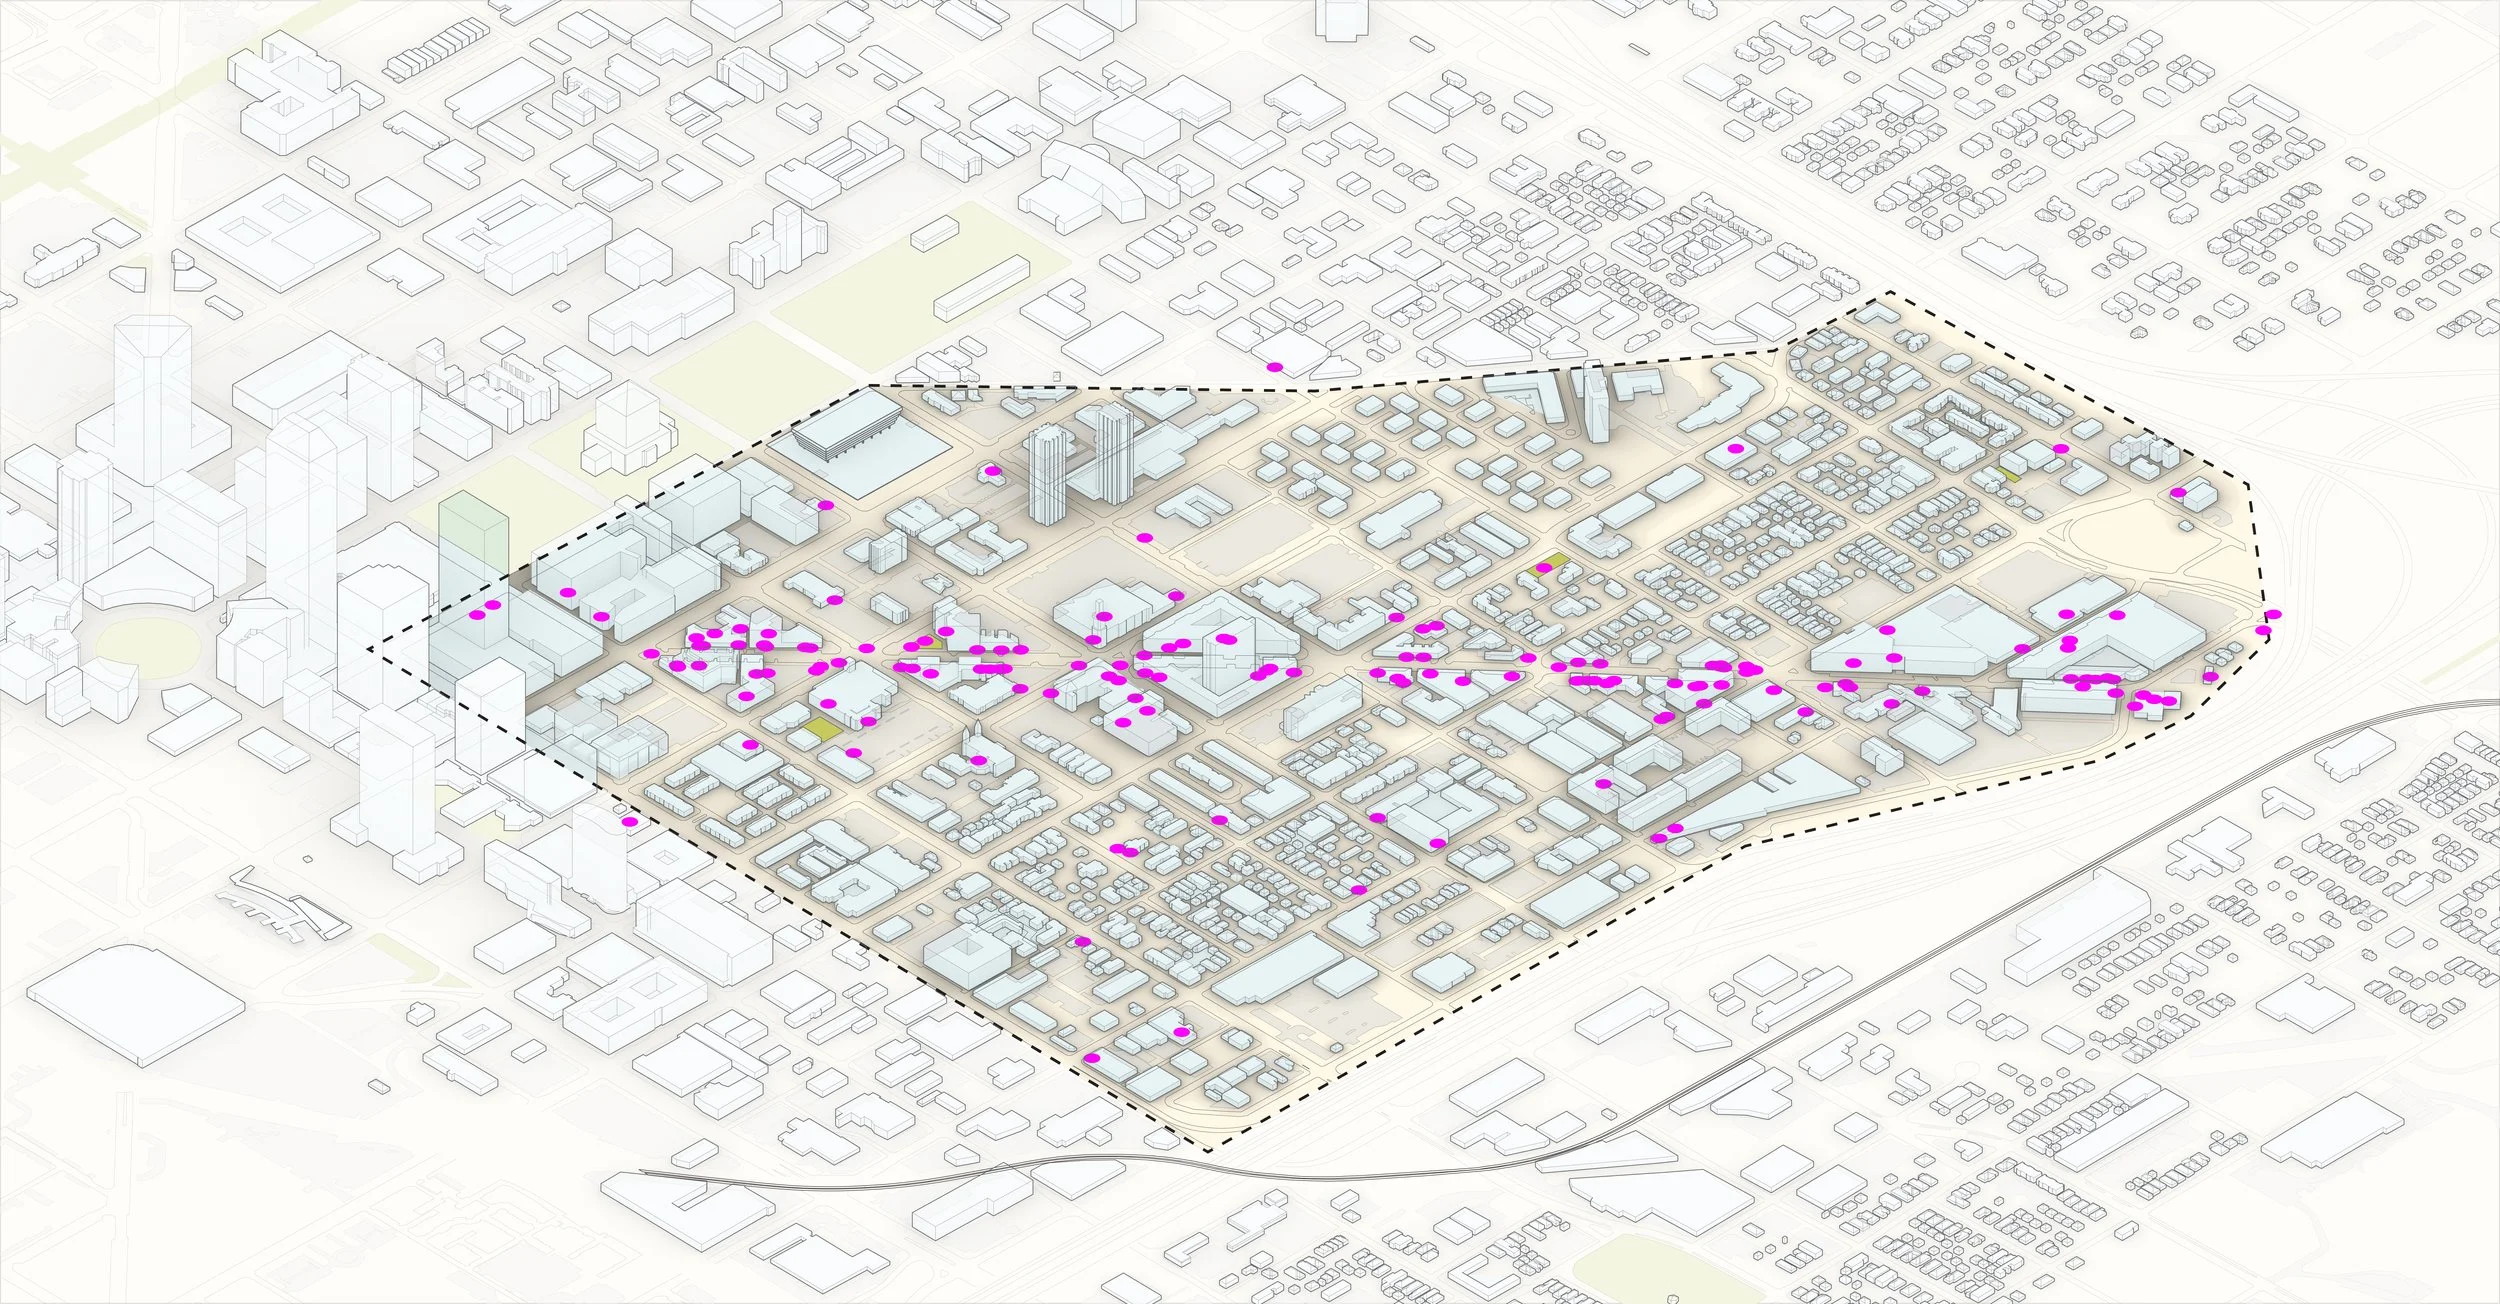
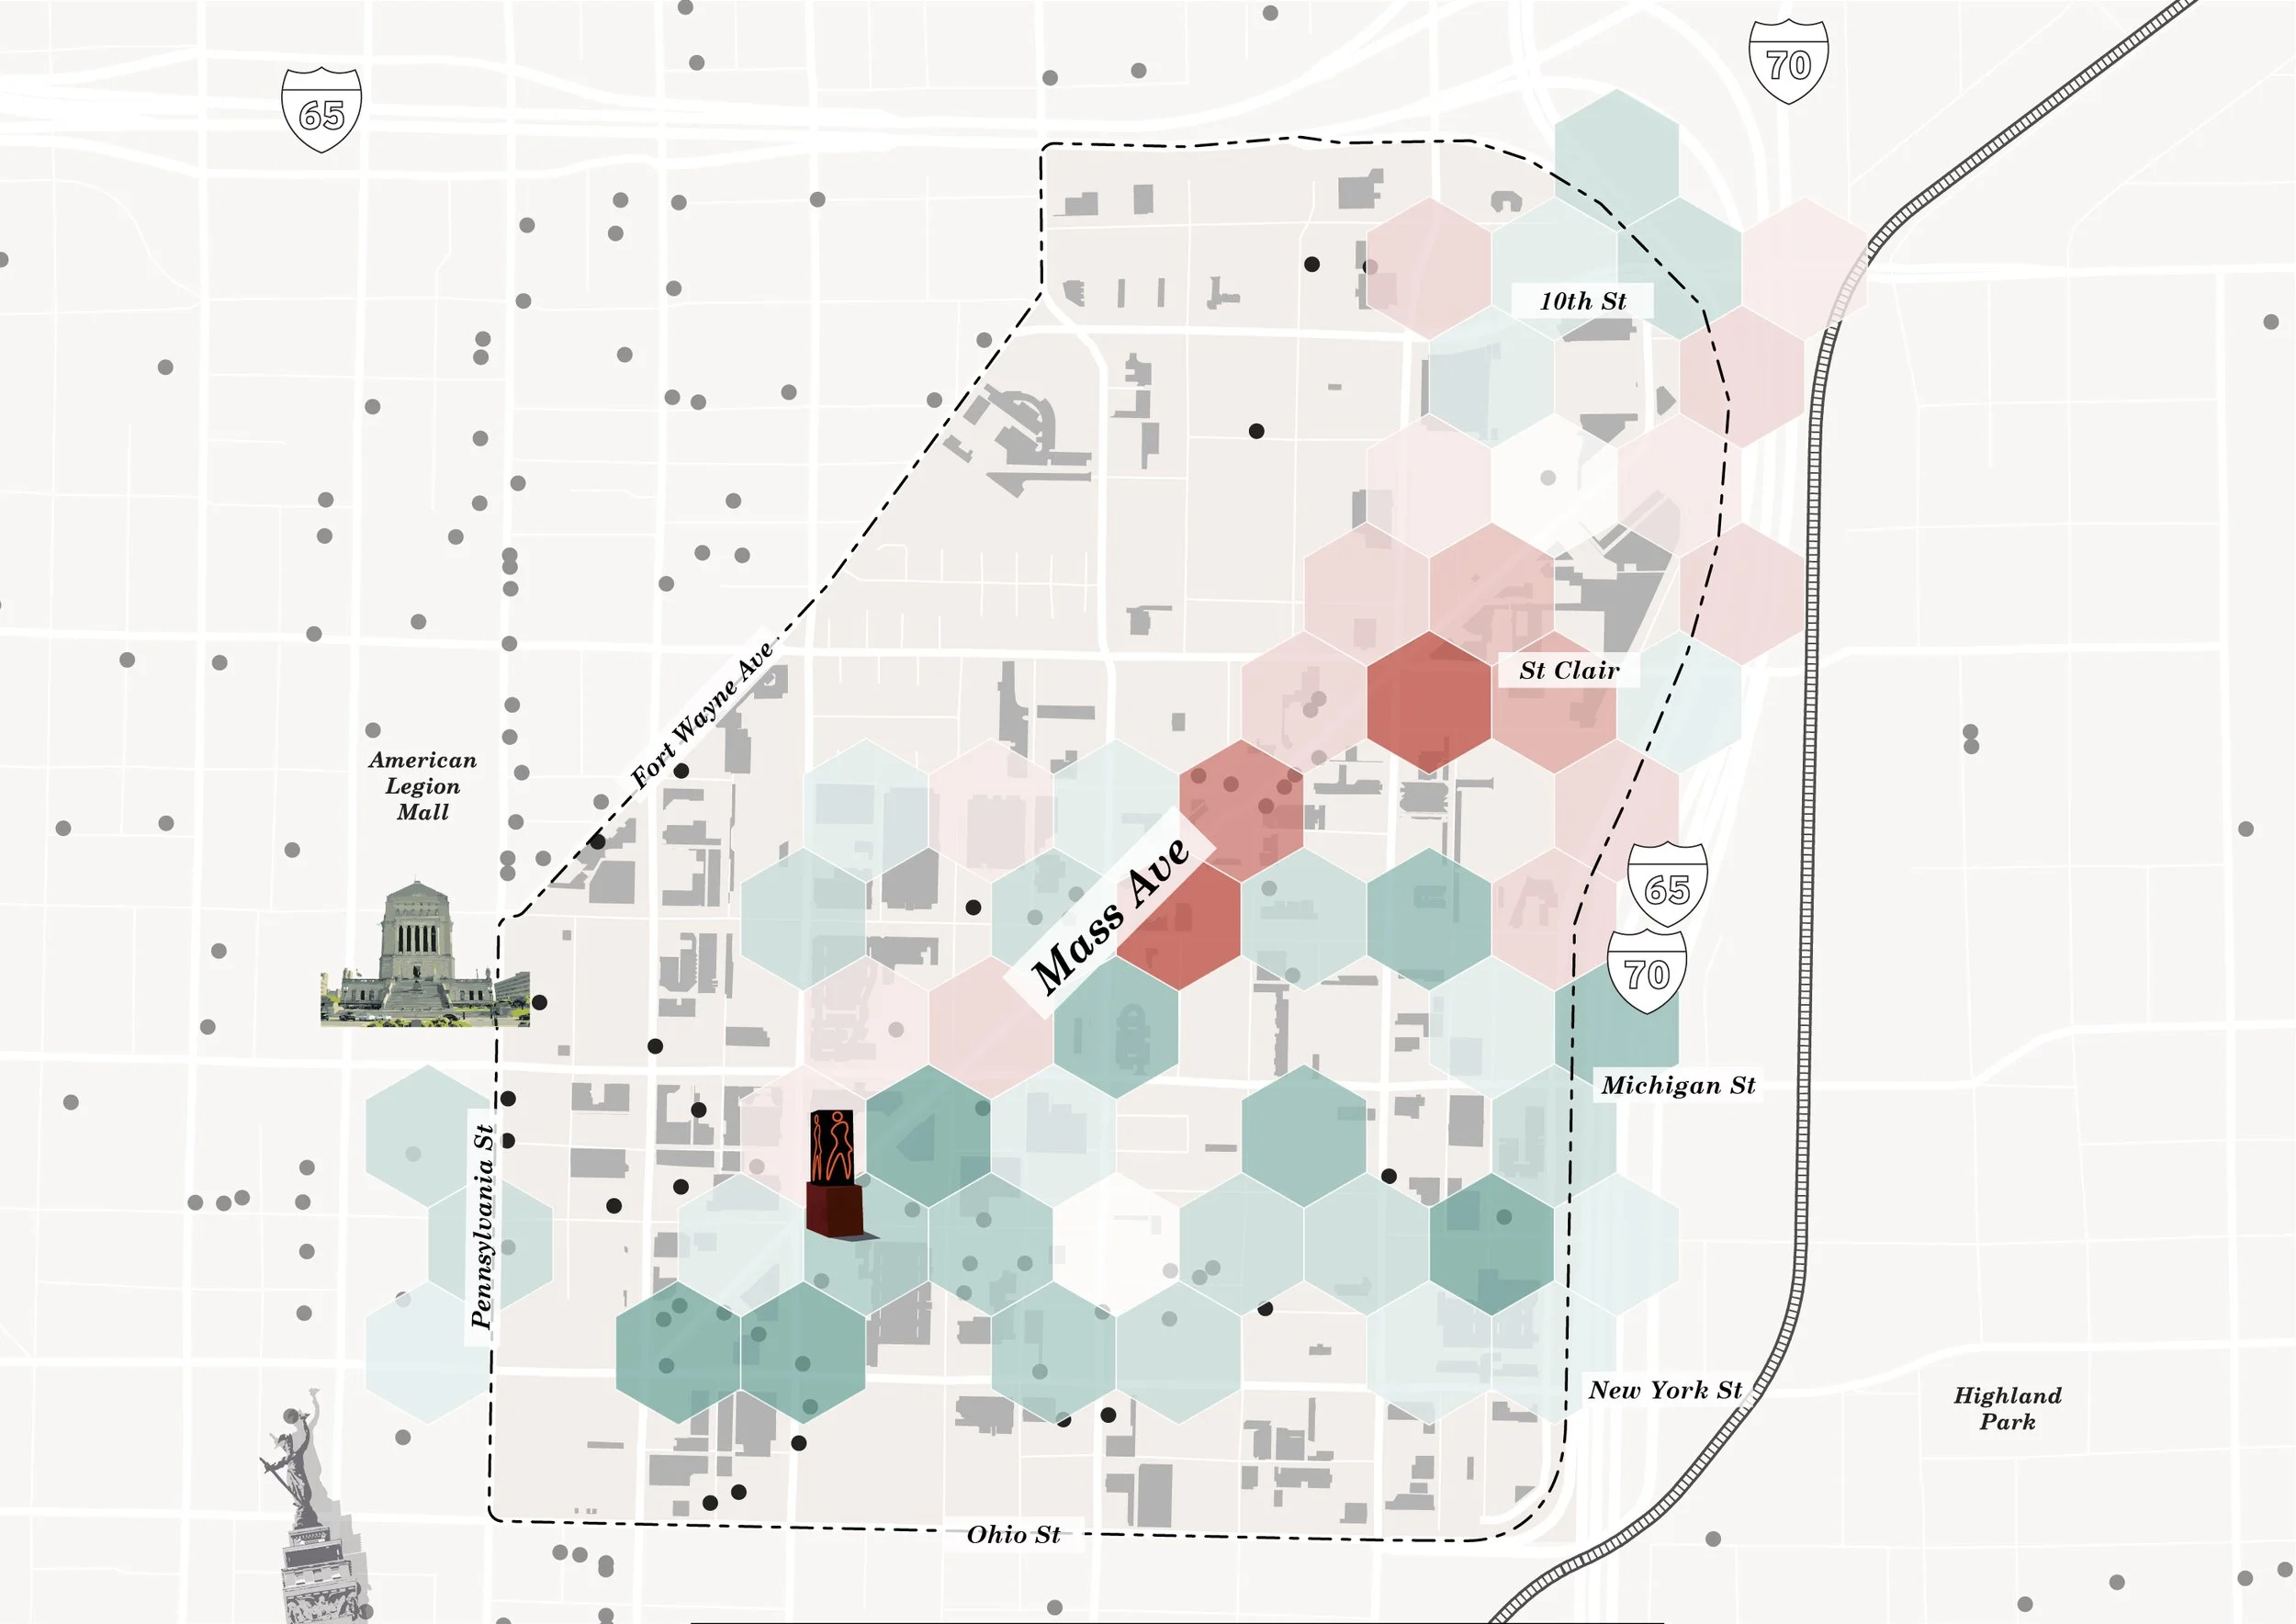
Open SpaceExperience ≠ brand becomes a developed public realm. Streets as stages, public art restored and programmed rather than merely installed, the Cultural Trail widened into the district's spine — and the people who produce the culture kept close enough to staff it.
On the map: discomfort clusters at the Marathon station area, while the 300 and 800 blocks form a dumbbell of interest — the under-programmed middle between them is the opening.
Arts & ExperienceThe frameworks, drawn
Challenges become opportunity
The answer the community gave
Each framework carries four to six site-specific concepts pairing a real parcel with a design move, the fiscal-productivity math behind it, and the policy tools that can fund it. And the direction they add up to is the one the community named: asked what Mass Ave should be known as by 2036, the leading answer wasn't a regional destination — it was a vibrant neighborhood. The next decade's strategy is not more of the last one's growth. It is making the growth already here worth staying for.
U.S. Census Bureau ACS 5-year estimates (2006–2010 through 2020–2024), Marion County Assessor parcel records and Proformus fiscal-productivity analysis, LEHD/LODES commute flows, visitation analytics, and Proformus engagement analytics (400+ respondents through June 2026; geocoded Map Your Mass comments; Maptionnaire map survey in the field July–August 2026). Report figures reproduced from the Mass Ave Next Existing Conditions Report Pt. 1, Summary (draft, June 2026); demographic figures reflect Census Tracts 3542.01 and 3542.02 rather than the district boundary. Survey findings reflect self-selected respondents skewing higher-income — read them as consistent, pronounced patterns rather than a representative cross-section. Sub-area population shifts are tract-level estimates; read direction, not decimals. Dollar figures in constant 2024 dollars (BLS CPI-U). Guiding principles shown as working drafts, subject to refinement through the workshop series.
Project Details
- Client
- Mass Ave Cultural Arts Distict
- Location
- Indianapolis, Indiana
- Status
- In Progress
- Partners
- City of Indianapolis, Indianapolis Foundation
Key Services
- Cultural & Asset-Based Mapping
- Engagement Strategy & Facilitation
- Comprehensive & Neighborhood Planning
- Corridor & District Frameworks